 VoltGrid
VoltGrid
Geospatial intelligence for the electric grid. A powerful desktop GIS, CAD, and BIM 3D digital twin solution for electric utilities — and it works operationally with GRID State, Tech Maven Geospatial's electric utility management solution. Fully offline-capable.
Tech Maven Geospatial · v1.6.0
Your grid lives in silos.
- Siloed GIS / CAD / BIM — asset records, as-built drawings, and substation models sit in tools that never share a map.
- Storm response goes dark — when the storm rolls in and backhaul drops, cloud GIS drops with it.
- Enterprise GIS cost — server farms, per-seat licenses, and dedicated staff before the first feeder is mapped.
- Field disconnect — crews in the right-of-way can't see, or feed, the operating picture.
One desktop. The whole grid picture.
An embedded local server turns any Windows workstation into a complete, air-gapped grid intelligence hub — hosting, editing, analyzing, and sharing utility data across the ops LAN.
No server farm
The desktop is the server.
No cloud
Grid data stays inside your OT boundary.
No infrastructure tax
Runs on hardware you already own.
Everything a utility GIS team needs.
3D / Z GPKG EditorNew
True 3D asset editing over GeoPackage.
Desktop-as-a-Server
One-click sharing across the ops LAN.
3D Digital Twin
I3S, BIM, splats, point clouds, COG.
Analysis
Viewshed, routing, profiles, stats.
Real-Time Feeds
Crews, weather, TAK, Meshtastic (MQTT), IoT.
Data Mastery
30+ formats, read & converted.
Five capabilities that landed first.
STAC
Find pre/post-storm & vegetation imagery fast.
Connectors
Utility databases → MVT / OGC / FeatureServer.
Full Motion Video
Drone inspection video, geo-locked (MISB KLV).
CAD Import
As-built DWG / DXF / DGN onto the map.
Feeds & StreamServer
Sensor feeds → Esri StreamLayer.
All offline
Served from the in-process host on :5059.
Every format in. Every protocol out.
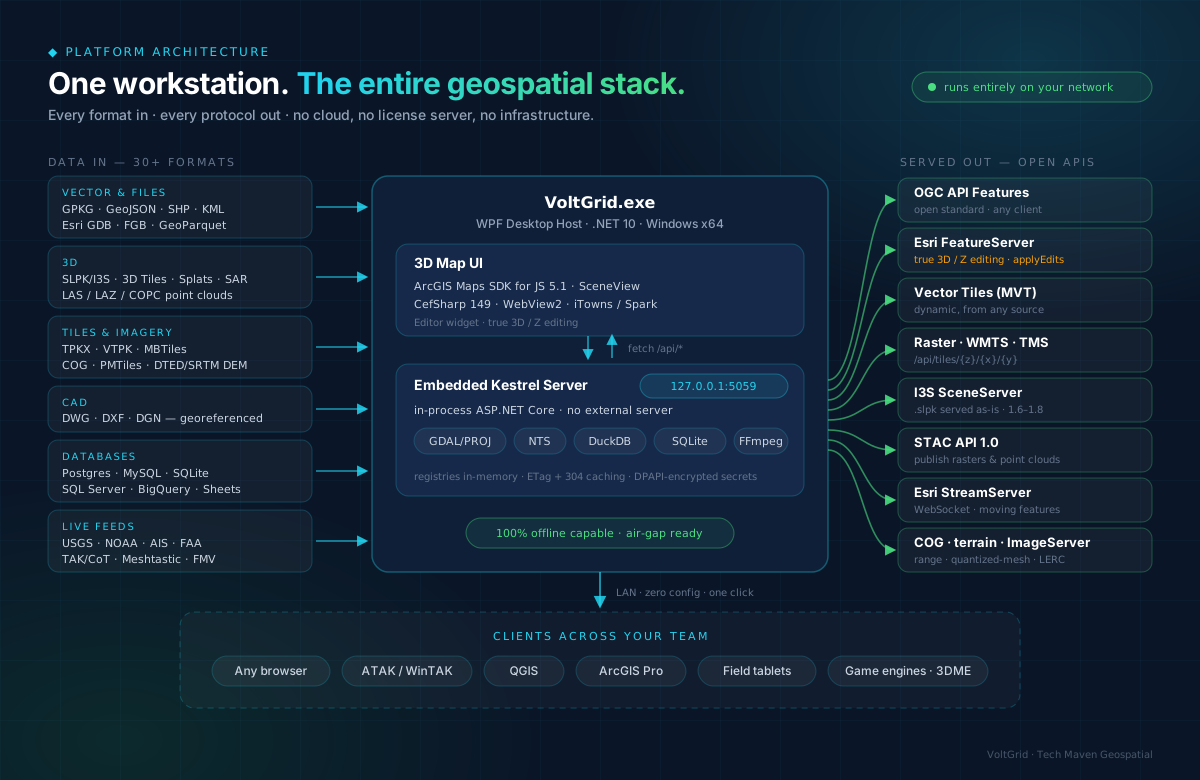
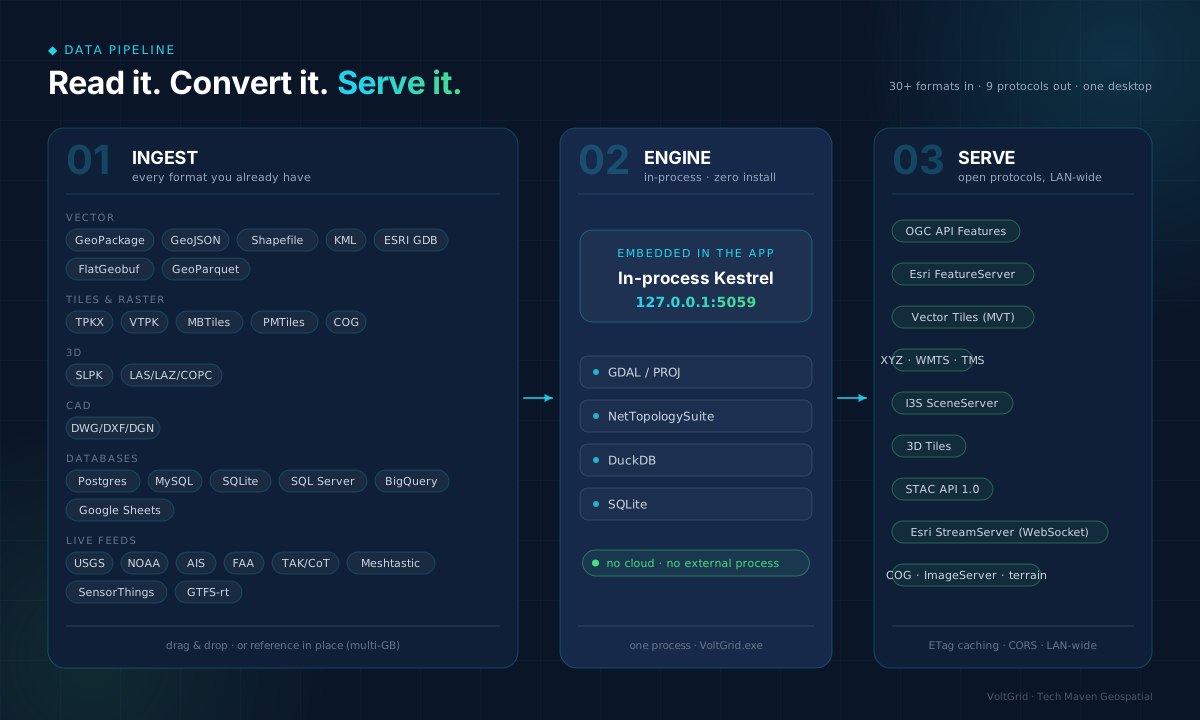
Read it. Convert it. Serve it.
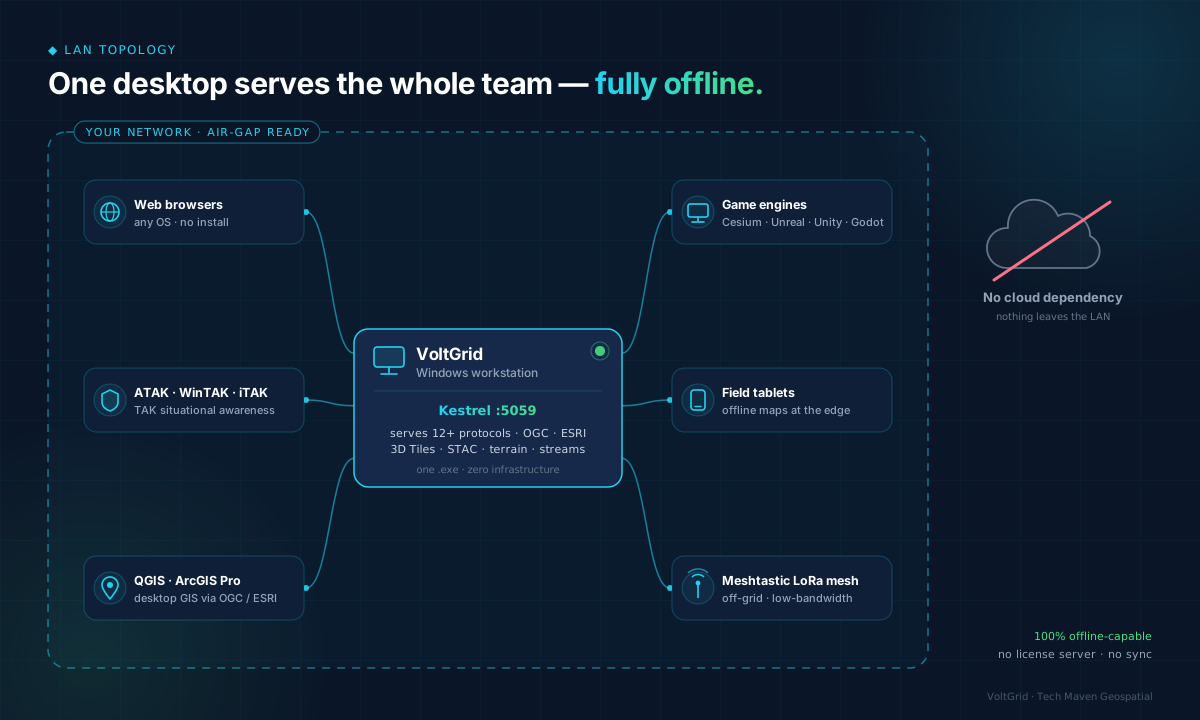
One desktop serves the whole storm room.
Then it became a grid intelligence workstation.
The newest releases add field crew comms, radar and SAR exploitation, imagery intelligence, local AI, RF sensing, offline routing, GIS-server emulation, SharePoint, commercial imagery tasking, 3D reconstruction, and a plugin SDK — sixteen new capabilities for utility operations on the same desktop.
Storm response that speaks CoT.
- TAK Server via STOMP mTLS-wss — or UDP multicast when backhaul is gone.
- Crew-tracking overlay, GeoChat, operation tasks, alerts, geofencing around energized work zones.
- Operations Board kanban + collaborative canvas + AAR timeline replay for storm post-mortems.
- TAK Server admin dashboard (Marti REST proxy) + data packages for crew devices.
- NAPSG & NWCG emergency symbology · MIL-STD-2525 supported · structured field reports.
storm-pkg.zip
├─ manifest.xml
└─ contents/
   └─ cot.xml        // CoT events

● multicast · air-gapped
● geofence ALERT: CREW-2 exited work zone
Know what's flying over your corridors.
- ASTERIX CAT-048 radar ingestion over UDP multicast.
- Live Track Table — callsign, squawk, flight level, speed, heading, ICAO24.
- CPA calculator — deconflict drone inspection flights from working aircraft.
- Velocity vectors (3-min lookahead) · trails (last 30 positions).
- Squawk alerting — 7500 / 7600 / 7700 auto-detected during storm air ops.
UAL231  3452  FL340  447kt  094°
DAL88   7700  FL180  322kt  201°
          └─ EMERGENCY · alerting

CPA(UAL231, DAL88)
 → 4.2 nm in 06:12 brg 142°
Storm-ops sensing, fused onto one map.
ADS-B + RemoteID
Inspection drones & aircraft near the ROW.
AIS
Vessel traffic near river crossings & cables.
APRS
Spotter stations, WX, objects — RF + APRS-IS.
Audio scanners
NOAA+SAME weather alerts · GMRS · MURS · CB.
IoT (rtl_433)
Weather stations & sensors along the corridor.
One DuckDB hub
Every source queryable + servable.
Assess damage at night. Through clouds.
- SAR amplitude viewing — Sentinel-1 when the storm still blocks optical, speckle filtering, dB rendering.
- ImageServer-grade imagery: spectral indices (NDVI, NDWI, NBR…) for vegetation stress and burn severity.
- YOLO-E detection: COG window → detect → georeferenced FeatureSet.
- Damage annotation & PDF reporting · RPC mensuration with CE/LE.
GET …/ImageServer/exportImage
    ?renderingRule=SarAmplitudeDb

→ analysis-ready backscatter
→ NDVI · NDWI · NBR on demand
AI that never phones home.
- Gemma 3 / Phi-4 local LLM — geospatial chatbot + NL→SQL over your asset layers.
- SAM2 segmentation — Meta's Segment Anything 2 on any COG window (point / box prompt → GeoJSON polygon).
- YOLO-E detection on stills and inspection FMV — detections can broadcast as CoT.
- llama.cpp sidecar on your hardware — no cloud AI, no data egress from the OT network.
// "poles last inspected before 2020"
SELECT * FROM poles
WHERE inspected_yr < 2020
  AND ST_DWithin(geom, feeder_12, 500)
→ layer on the map
Click. Digitize. Done.
SAM2 segmentation
Meta Segment Anything 2 — point or box on any COG → GeoJSON polygon. Building footprints, flood extent, ROW vegetation. sam2-tiny → sam2-large.
Magic Wand
CIELAB delta-E flood fill — port of the Kanahiro QGIS plugin. No model, no GPU, no sidecar. Millisecond polygon capture from any raster.
YOLO-E detection
Zero-shot detection on drone video and still imagery — equipment, damage, encroachment.
Three complementary tools: foundation-model segmentation for complex scenes, color-based capture for fast one-offs, detection for class-labelled finds. All local inference.
Your enterprise lakehouse, on the map.
- Read Delta tables straight from OneLake — no extract, no Power BI export.
- DuckDB core
azure+delta+spatial— no community-extension binary to track. - Account key encrypted with Windows DPAPI; never on disk in cleartext.
- Per-table views via
delta_scan('abfss://...')— you name the tables; no bucket-listing surface. - Read-only by design. Pair with GRID State for the operational write layer.
{
  "kind": "FabricLakehouse",
  "oneLakeUri": "abfss://ws@onelake...
                /Assets.Lakehouse",
  "tableFilter": ["poles",
                  "conductors",
                  "outages"]
}
→ DPAPI-encrypted profile
→ views via delta_scan()
→ /api/spatial/fabric-prod/…
Crew routing that never phones home.
- In-process A* over your own DuckDB road graph — no OSRM, no Docker, no cloud.
- Multi-waypoint damage-site runs with per-leg turn-by-turn.
- Vehicle / foot / cycle modes · GPX 1.1 + KML 2.2 export for crew devices.
- City/region scale (~100k nodes) solves in <1s.
- Optional Esri World Routing toggle when online (credits apply).
{
  "origin": {"lat":34.05,"lon":-118.24},
  "dest":   {"lat":34.09,"lon":-118.36},
  "options": {"travelMode":"vehicle"}
}
→ route + legs + instructions
Speaks your GIS stack's language. Then becomes one.
Consume
ArcGIS Portal / Server / AGO, GeoServer, QGIS Server, MapServer.
Emulate
FeatureServer · ImageServer · StreamServer · SceneServer · tiles.
Hub & Living AtlasNew
Browse, search, download, load-to-map.
GeoPackage Studio
Design, import, edit, export — plus Z editing.
GADM boundaries
Service-territory admin breakdown, offline.
Connect-to-GIS
Discoverable catalog for QGIS / ArcGIS Pro across the utility.
Your inspection lists are map layers now.
- Any list becomes a FeatureLayer, vector tiles, or OGC Features.
- Entra ID delegated sign-in (PKCE) — every field edit attributed to the inspector.
- Five geometry shapes auto-detected — lat/lon, Geolocation, WKT, GeoJSON, address.
- Edit in the attribute table — writes flow back via Microsoft Graph, delta sync refresh.
// Pole Inspections list → layer
GET /api/spatial/{id}/FeatureServer
PATCH → Graph listItem ✓ written back
// delta sync: only changed rows
Task the bird from the storm room.
- Planet · Sentinel Hub · Skywatch · SkyFi — your own accounts.
- Draw an AOI over the damage corridor, filter by date / cloud cover, search four catalogs in one dialect.
- Archive and tasking orders with live status polling.
- Delivered scenes land as map layers; Sentinel Hub can live-stream tiles with no purchase.
- The app never handles billing — every call runs under your credential.
{
  "aoi": "drawn bbox",
  "cloudCover": {"lt": 15},
  "source": "PSScene, sentinel-2-l2a"
}
→ unified EoScene[] · 🛒 order
Rebuild the substation. Extend the platform.
roofer LoD2.2
Point cloud + footprints → building models for the substation twin.
FUSION/LDV
30-command LiDAR toolkit for ROW vegetation.
Splat training
Postshot / COLMAP / OpenSplat pipeline.
Plugin SDKNew
One folder: manifest + .NET + TS tiers.
Extension points
REST routes, sidebar tools, workers, layer types.
Drop-in install
No rebuild of the app — discovered at startup.
Unified where everything else is stovepiped.
| Capability | Commercial GIS | Point utility tools | VoltGrid |
|---|---|---|---|
| Air-gapped / OT operation | limited | rarely | yes, by default |
| GIS + CAD + BIM + field ops unified | no | single-purpose | one map |
| 90+ searchable tools | no | no | yes |
| Open data formats | partial | proprietary | GPKG · COG · DuckDB · OGC |
* Comparative rows are positioning statements, not benchmark results.
Built for the storm room.
- Storm response — crew tracking + damage imagery + tasked commercial collection in one operating picture.
- Vegetation & ROW — multispectral indices + LiDAR + change detection along the corridor.
- Transmission corridor planning — terrain analysis, viewshed, routing, CAD overlays.
- Substation digital twin — BIM/IFC import + LoD2.2 reconstruction + point clouds.
- Wildfire risk — burn indices + NWCG symbology + geotagged field photo intake.
Search the world's imagery. Publish your own.
- Browse Element 84 & Planetary Computer for pre/post-event scenes from one search box.
- Auto-detects CQL2 vs the
queryextension; SAS signing handled. - Publish a folder of corridor rasters + clouds as a STAC API 1.0.0 at
/stac.
{
  "collections": ["sentinel-2-l2a"],
  "datetime": "2026-05/2026-06",
  "query": {"eo:cloud_cover":{"lt":10}}
}
→ ImageryTileLayer, signed
Map the data your utility already has.
Postgres / PostGIS
postgres_scanner
MySQL
mysql_scanner
SQLite · MSSQL
bundled + ODBC
BigQuery
ADC attach
Google Sheets
lat/long virtualized
3 facades
MVT · OGC · FeatureServer
Inspection video, geo-locked to the line.
- Parses MISB ST 0601 KLV; live RTSP/UDP/SRT streams.
- Sensor footprint tracked on the map frame-by-frame along the corridor.
- DJI → STANAG conversion from inspection-flight SRT / logs / EXIF.
- Optional YOLO-E object detection sidecar for pole & tower review.
// DJI clip + telemetry → STANAG .ts
POST /api/fmv/dji-convert
  file   = DJI_0012.MP4
  srt    = DJI_0012.SRT

→ MISB ST 0601 .ts
→ footprint on map ✓
As-built drawings meet the real grid.
- Reads DWG / DXF / DGN via managed OGR +
ogr2ogrfallback. - Georeference with control points (affine / polynomial-2, RMSE preview) or source EPSG — rubber-sheet substation drawings onto the map.
- Outputs GeoJSON, MBTiles-vector, or GeoPackage — reprojected to EPSG:4326.
- Served as tiles, OGC Features, and FeatureServer under
/api/cad/{id}. - Pairs with PLS-CADD import — structures + conductors, with FileGDB / PostGIS / GPKG / GeoJSON export.
Live feeds in. ArcGIS StreamLayer out.
- Subscribe to SensorThings · SOS · GTFS-rt · Moving Features into DuckDB.
- Raw WebSocket StreamServer speaks the Esri JSON protocol — no SignalR.
- Per-subscriber
wherefilters + DuckDB-backed history. - MQTT mesh, TAK, GNSS crew tracks → native ArcGIS StreamLayer.
GET /api/stream/{id}/StreamServer
 → streamUrls[0].url

ws  /api/stream/{id}/subscribe
POST /api/stream/{id}/ingest
GET  /api/stream/{id}/query
     ?startMs=&endMs=

// paste URL into ArcGIS Pro
Edit grid assets in true 3DNew
- Full Z + M ordinate round-tripping — ESRI JSON ↔ NTS ↔ GPKG blob.
- ESRI-compatible FeatureServer REST contract.
- Native ArcGIS Editor widget — attachment heights, conductor Z, substation features.
- Schema-driven
hasZ/hasM.
{
  "geometry": {
    "x":-74.006,
    "y":40.712,
    "z":1500.5
  }
}
// z preserved exactly ✓
Zero infrastructure. One click.
- One-click activation — share across the ops floor in seconds.
- Auto DHCP — zero manual configuration.
- Universal access — any OGC/ESRI client: ArcGIS Pro, QGIS, WinTAK.
- Real-time monitoring of endpoint health.
GET /api/features      OGC
GET /tiles/{z}/{x}/{y} raster
GET /cog/tiles/…       COG stream
GET /api/featureserver ESRI

● live on 192.168.1.24
Multi-protocol serving.
OGC API Features
Modern RESTful feature API.
ESRI REST
FeatureServer / ImageServer.
3D Tiles
Streaming massive 3D.
Vector Tiles
Fast PBF rendering.
COG
HTTP range streaming.
SpatiaLite / DuckDB
ST_AsMVT analytics.
Render every kind of grid reality.
I3S from .slpk
IntegratedMesh, 3DObject, Point.
Gaussian Splats
Photoreal substation walk-downs via Spark.
LiDAR Point Cloud
Corridor scans — LAS/LAZ/COPC → I3S SLPK.
OGC 3D Tiles
iTowns streaming.
Cloud GeoTIFF
Range-streamed imagery.
Scene Controls
Lighting, shadows, atmosphere.
Decide with the terrain.
- Shadow & solar-potential analysis.
- Viewshed, line-of-sight, slope & aspect for corridor siting.
- Routing & multi-stop crew-run optimization.
- Hot-spot, clustering, spatial statistics.
- Elevation profiles & 3D measurement along the span.
{
  "observerZ": 100,
  "viewDistance": 1000
}
→ 360° visibility, mapped
The field, live on your map.
USGS
Live earthquakes near grid assets.
FAA / AIS
Aircraft & vessels near the ROW.
Meshtastic
LoRa mesh via MQTT.
TAK / CoT
ATAK / WinTAK / iTAK crews.
APRS
Amateur radio positions.
IoT & Sensors
Custom device streams.
One shared picture for every crew.
GeoChat
TAK-native crew messaging.
Tasks & AAR
Assign, track, replay the response.
Crew Awareness
Live positions & status.
All channels run over the in-process local server — coordination never leaves the network you control.
Air-gapped. By default.
Runs entirely offline — built for OT environments, regulated grid data, and storm ops with no backhaul. Distributed by nature — any workstation becomes a server, so there's no single point of failure.
A modern, dependency-light stack.
- .NET 10 · WPF desktop host with in-process ASP.NET Core / Kestrel.
- CefSharp.Wpf.NETCore 149 + WebView2 for hardware-accelerated rendering.
- ArcGIS Maps SDK for JavaScript 5.1 — primary SceneView.
- NetTopologySuite 2.6.0 · DuckDB · SpatiaLite · GDAL · OGR.
- iTowns · Spark · Three.js — all vendored locally for air-gap use.
- MISB ST 0601 KLV · STAC API 1.0.0 · GTFS protobuf · raw WebSockets for StreamServer.
* Reflects the .csproj / ARCHITECTURE.md build, not the stale README stack.
Built for every corner of the utility.
Investor-Owned Utilities
T&D engineering & GIS teams.
Electric Cooperatives
Big capability, small IT footprint.
Municipal Utilities
City-scale grid digital twins.
Storm & Emergency Ops
Damage assessment & crew coordination.
Vegetation Management
ROW & encroachment monitoring.
Utility Consultants
Portable, air-gap-friendly toolkit.
Pairs with GRID State.
- GRID State — Tech Maven Geospatial's robust electric utility management solution: asset, operations, and network state management.
- VoltGrid — the desktop geospatial / 3D digital twin companion that gives those assets a living map.
- Works operationally together — GRID State manages the utility's operational records; VoltGrid lets you visualize, edit, analyze, and coordinate in the field.
- One vendor, one grid picture — from the record of the grid to the 3D reality of it.
The enterprise GIS you don't have to buy.
| 5-year TCO | Traditional | VoltGrid |
|---|---|---|
| Total cost | $565,000 | $32,000 |
| Net avoided | $533,000 | |
* All ROI / TCO figures illustrative — from internal planning docs.
Why not the alternatives?
| Enterprise GIS Server | Cloud GIS | VoltGrid | |
|---|---|---|---|
| Deployment | weeks | hours + cloud setup | seconds |
| Hardware | dedicated | cloud subscription | existing desktop |
| Data control | on-prem | leaves org | LAN-only |
| Offline / storm ops | limited | no | fully air-gapped |
| Cost | high | recurring | low, fixed |
“Having crew tracking and damage imagery on one offline map cut hours off our storm assessment.”
— Storm Response Director, Regional Electric Utility
DER · OMS · vegetation & storm · EAM.
DER hosting
Feeder capacity choropleth + interconnection kW screen against planner tables and PLS-CADD circuits.
OMS / SCADA overlay
Outage polygons + telemetry points via GeoJSON/CSV push or poll URL — SSE live, vendor-SDK-free.
Corridor change detection
Before/after COGs: ΔNDVI, height-proxy, storm/burn — corridor-buffered hotspots + findings.
Maximo · Cityworks
Assets & work orders on the map via loopback EAM sidecar — DPAPI secrets, hybrid geo.
Trace it. QA it. Chart it. Pack it.
Network Trace
Upstream / downstream / both over PLS-CADD topology + isolation preview — which structures go dark when you open cut points.
As-built vs Design
Design vs survey deltas — horizontal offset, Δz, Δh AGL, spans — severity-graded into the findings layer.
ROW Encroachment
Corridor buffer ∩ parcels / buildings / roads — encroachments ranked by intersection area.
Data Charts
Plotly from live layer attributes with bidirectional chart↔map selection — DataPlotly parity, offline.
Offline tile packs
AOI → MBTiles from any XYZ/TMS source, style + glyphs bundled, air-gapped MapLibre viewer. 7 Maptoolkit basemaps online.
My Layers
Bring your own transmission FeatureLayer + additive 3D scene to the Transmission Analyzer — merged config, live reload.
Choose your deployment.
Starter
5 users · basic training · email support.
Professional
25 users · priority support · full pillars.
Enterprise
Unlimited · dedicated success · air-gapped.
* Draft planning tiers — final pricing to be confirmed.
The utility roadmap.
- Now — PLS-CADD import, Transmission Analyzer (sag/clearance/vegetation/thermal… + operator My Layers), network connectivity trace & isolation preview, as-built vs design QA, ROW encroachment, DER hosting choropleth, OMS/SCADA overlay, corridor vegetation & storm change detection, Maximo / Cityworks EAM read (with geo core), data charts, offline tile packs, CAD modernization, 3D/Z GPKG editing.
- Next — DER study import / time-series choropleth (merge-ready), deeper substation & inspection workflows, EAM write-back, native OT protocol adapters (DNP3 / ICCP) where gateways aren't enough.
- Future — outage prediction / restoration ETA, full OpenDSS/CYME in-process studies, CMMS bidirectional sync.
- Together — deeper operational pairing with GRID State across the product line.
* Roadmap items are forward-looking and subject to change. Shipped items above are on main.
Ready to see it in action?
Run the installer. In seconds your workstation is hosting, editing, and sharing the grid's geospatial picture — no cloud, no server farm, no waiting.
Tech Maven Geospatial, LLC · 1856 North Nob Hill Road, Suite #216, Plantation, FL USA 33322-6548
VoltGrid · Geospatial Intelligence for the Electric Grid · v1.6.0