VoltGrid turns any Windows workstation into a complete, offline-capable grid intelligence workstation for electric utilities — desktop GIS editing, CAD and BIM import, LiDAR and drone imagery, 3D substation and corridor visualization, and storm-response crew coordination. And it works operationally with GRID State, Tech Maven Geospatial's electric utility management solution. No cloud. No enterprise server farm. No infrastructure tax.
Substation models live in CAD. As-builts live in BIM. Asset records live in GIS. Enterprise GIS servers cost a fortune and take weeks to stand up — and when a storm rolls in and the network fails, crews in the field lose the map exactly when they need it most.
Corridor GIS, substation DWGs, and IFC building models sit in separate tools. Engineers re-draw what the utility already owns.
Server hardware, per-core licenses, and a half-FTE just to keep the stack alive — before a single feeder is mapped.
When backhaul fails at an emergency operations center or staging yard, cloud GIS goes dark — right when damage assessment starts.
An embedded high-performance geospatial server inside the desktop: 30+ formats and the databases your utility already runs go in, open standards come out — OGC, Esri REST, I3S, STAC, vector tiles, streams. Nothing leaves your network.
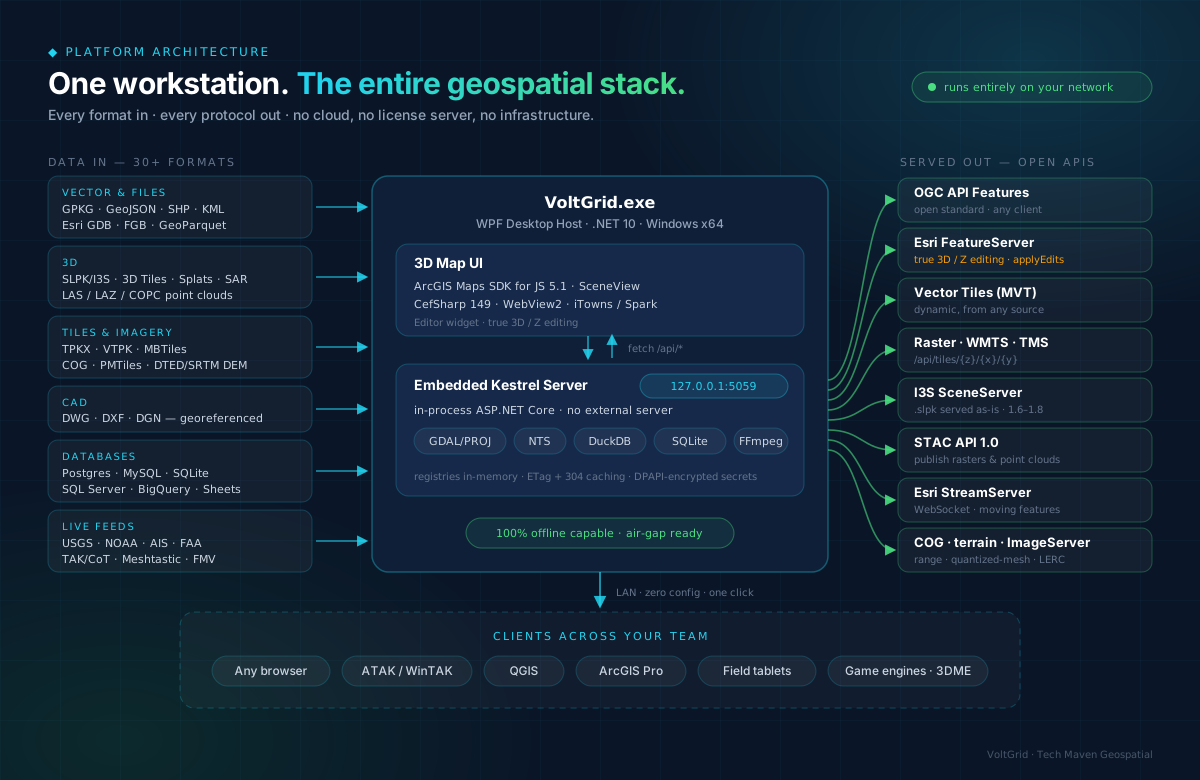
Full technical architecture with request flows and data pathways in ARCHITECTURE.md
With its embedded local server, the desktop hosts, serves, edits, analyzes, and shares the utility's geospatial data — fully offline if required.
True 3D (Z + M) editing over GeoPackage through an ESRI-compatible FeatureServer and the native Editor widget — pole tops, conductor attachments, and structure heights round-trip exactly.
Deep-dive →One click turns the workstation into a LAN-wide OGC / ESRI / 3D-Tiles endpoint — an EOC, a staging yard, or a back office shares grid data with zero infrastructure.
How it works →I3S SceneLayers from .slpk, Gaussian splats, OGC 3D Tiles, LiDAR point clouds of corridors and substations, and streaming Cloud-Optimized GeoTIFF.
See the stack →Shadow & solar potential, viewshed, slope/aspect, routing, spatial statistics — siting, clearance, and access questions answered with live 3D visualization.
Explore tools →NOAA weather, USGS quakes, AIS vessels, FAA aircraft, Meshtastic (MQTT), TAK/CoT, APRS, and IoT sensors — situational awareness for storm and wildfire operations.
Live data →GeoPackage, GeoJSON, ESRI Geodatabase, Shapefile, KML, PMTiles, FlatGeobuf, COG — every format your GIS shop already holds: read, convert, serve.
Full format list →VoltGrid pairs with GRID State, Tech Maven Geospatial's robust electric utility management solution. GRID State manages the utility's assets, operations, and network state; VoltGrid gives those assets a living geospatial 3D context — visualize, edit, analyze, and coordinate in the field.
Asset, operations, and network state management — the authoritative operational picture of the utility.
The desktop GIS / CAD / BIM 3D digital twin companion — those same assets in geospatial 3D context, on every workstation, even offline.
Manage in GRID State, see and work the grid in VoltGrid — from corridor planning at the desk to damage assessment in the field.
Beyond the six pillars — search public imagery catalogs for corridor collects, map the databases your utility already runs, fly drone video geo-locked to the terrain, bring as-built CAD drawings onto the map, stream live feeds straight into ArcGIS, and serve terrain & imagery to Cesium, Unreal, Unity, and Godot for training and simulation enclaves.
Search Element 84 & Planetary Computer for pre/post-storm imagery from one box, and publish your own rasters and point clouds as a spec-conformant STAC API 1.0.0.
Search & publish →Postgres, MySQL, SQLite, SQL Server, BigQuery, Google Sheets — plus Microsoft Fabric OneLake (Delta tables via delta_scan) — the asset and inspection tables you already have, auto-discovered and served as MVT, OGC Features, and FeatureServer.
STANAG/MISB KLV playback with a live sensor footprint, DJI→STANAG conversion, and optional YOLO-E AI detection — review pole and tower inspection flights geo-locked to the line. RTSP/UDP/SRT supported.
Geo-locked video →DWG / DXF / DGN as-builts and substation drawings onto the map via control-point rubber-sheeting or source-EPSG georeferencing — served as GeoJSON, MBTiles-vector, or GeoPackage.
Import drawings →Subscribe to SensorThings, SOS, GTFS-rt, and Moving Features into DuckDB — then expose moving data as a native Esri WebSocket StreamLayer.
Live streaming →Air-gapped terrain & imagery for Cesium, ArcGIS Maps SDK for Unreal/Unity, and Godot — quantized-mesh, WMTS, TMS XML, and LERC. For utility training, simulation, and planning enclaves.
Engine integrations →The full feature hub — the six pillars plus everything above, with deep-dive pages and the promo deck.
All features →The newest releases turn the desktop into a full grid-operations platform: storm-response crew coordination, radar and SAR exploitation for damage assessment, imagery analysis, local AI, RF sensing, offline routing to damage sites, GIS-server emulation — plus SharePoint lists as editable inspection layers, commercial satellite tasking, LoD2.2 building reconstruction, and a plugin SDK.
TAK Server + air-gapped multicast, live crew tracking, GeoChat, task board with after-action replay, geofencing — plus NAPSG & NWCG emergency-response symbology (MIL-STD-2525 also supported).
Crew picture →ASTERIX CAT-048 tracks with a live Track Table, CPA calculator, velocity vectors, and squawk alerting — airspace awareness around drone inspection operations.
Track the picture →SAR amplitude viewing that sees through storm cloud cover, speckle filtering, spectral indices for vegetation stress, YOLO-E detection, annotation, and RPC mensuration.
Exploit imagery →Gemma 3 / Phi-4 chatbot + NL→SQL over your asset tables, SAM2 segmentation (point/box → GeoJSON polygon), YOLO-E detection — all on your hardware, safe for OT environments, no cloud AI.
On-prem intelligence →Click-to-digitize from any raster — CIELAB delta-E flood fill traces color-similar regions into vector polygons. Port of the Kanahiro QGIS plugin. No model, no GPU, no sidecar — millisecond capture from orthophotos for building footprints, vegetation patches, flood extent.
Click. Digitize. →ADS-B, RemoteID drones, AIS, APRS, scanner audio, and rtl_433 IoT sensors — the RF picture around your territory fused onto one map.
Listen in →Air-gapped A* routing over your own road graph — route crews to damage sites when commercial nav is down. Multi-waypoint turn-by-turn, GPX/KML export, graph analysis.
Plan the route →Any SharePoint list — inspections, work logs, ROW records — as an editable map layer. Entra ID sign-in, five geometry shapes auto-detected, edits flow back via Graph.
Map the list →Search, task, and order from Planet, Sentinel Hub, Skywatch, and SkyFi — pre- and post-event collects over your service territory, your accounts, straight to the map.
Task the bird →LoD2.2 building reconstruction for substation and service-area twins, splat training, forestry LiDAR for vegetation work — and a drop-in plugin platform to extend it all.
Rebuild & extend →The newest shipping wave closes the control-room and vegetation-desk gaps: feeder hosting-capacity choropleth, live outage/telemetry overlay, corridor before/after change detection, and enterprise EAM / CMMS assets on the same map as PLS-CADD.
Import planner remaining-capacity tables, map feeder choropleths against PLS-CADD circuits, and screen a proposed interconnection kW vs headroom — with optional findings write-back.
Map headroom →Live outage polygons and telemetry points from GeoJSON/CSV push or poll URL — SSE updates, status coloring, quality rings. Vendor-SDK-free Phase 1 overlay.
Paint the outage →Before/after COG change detection — ΔNDVI encroachment, DEM/DSM height-proxy, or storm/burn brightness — scoped to a PLS-CADD corridor buffer with findings write-back.
Detect change →Assets and work orders from IBM Maximo and Cityworks on the map via a loopback sidecar — DPAPI credentials, hybrid geo resolution, GPKG cache.
Connect the EAM →The latest wave puts the electric network model to work: trace feeders and preview isolations, QA as-builts against design, sweep the ROW for encroachments, chart any layer's attributes with live map linkage, and pack basemaps into air-gapped MBTiles before the storm — all beside the enterprise systems you already run (Maximo, Cityworks, Microsoft Fabric OneLake, SharePoint).
Trace upstream / downstream / both from any structure over your PLS-CADD network — circuit filter, max hops, and an isolation preview that lists what goes de-energized when you open cut points.
Trace the feeder →Compare the design PLS-CADD model against the as-built survey — horizontal offset, Δz, Δheight AGL, and span deltas graded by severity, written to the findings layer.
Grade the build →Buffer the conductors into a corridor polygon and intersect parcels, buildings, and roads already in the hub — encroachments ranked by area, straight into the findings queue.
Sweep the ROW →Interactive Plotly charts from live layer attributes — scatter, bar, histogram, box, pie, violin — with bidirectional chart↔map selection and saved chart configs. DataPlotly parity, offline.
Chart the assets →Seven Maptoolkit vector basemaps online — and an AOI→MBTiles packager that harvests any XYZ/TMS source, bundles style/sprites/glyphs, and renders in a fully air-gapped MapLibre viewer.
Pack the tiles →The EAM / CMMS side of your enterprise landscape on the map: IBM Maximo and Cityworks assets & work orders, Microsoft Fabric OneLake Delta tables, SharePoint lists — read, geo-resolved, served.
Connect the enterprise →The headline capability of this release: a real, end-to-end 3D (Z + M) editing pipeline over GeoPackage, wired into the running app and the ArcGIS Editor widget — structure heights and attachment elevations survive the round trip.
hasZ / hasM read from gpkg_geometry_columns.edit3d.gpkg (POINT Z, POLYGON Z) on first run.// Z-enabled feature, absolute height mode { "attributes": { "name": "Tower-A" }, "geometry": { "x": -74.006, "y": 40.712, "z": 1500.5 } } → stored as POINT Z · hasZ: true · z preserved exactly
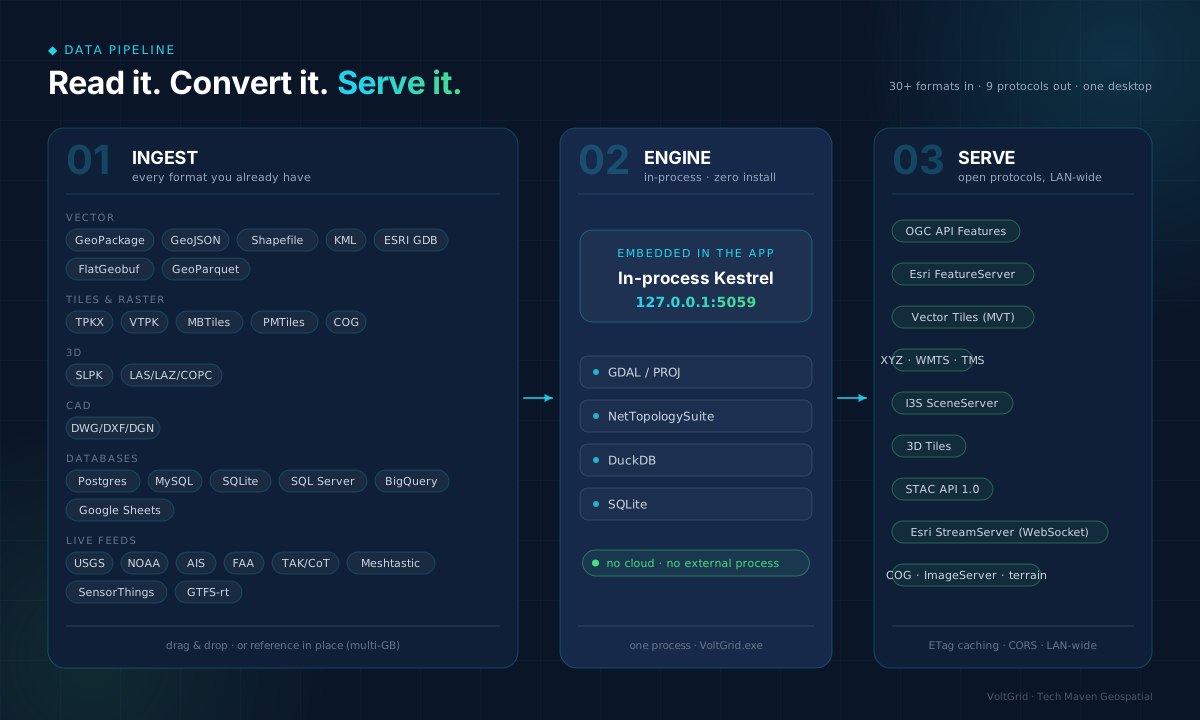
Drop a file — a PLS-CADD export, a substation DWG, a LiDAR collect — or point at a database, and it's on the map and on the wire. One process, zero installs, ETag-cached, LAN-wide.
* Capability counts reflect the documented platform scope. ROI and TCO figures appear on the ROI page and are illustrative planning targets.
Purpose-built toward electric-utility workflows — from corridor planning at the desk to damage assessment when the storm rolls in.
One offline-capable app for GIS editing, imagery, 3D, and enterprise data — instead of five stitched-together tools.
Transmission line & corridor mapping, PLS-CADD structure and conductor import, CAD as-builts rubber-sheeted onto the map.
Multispectral indices and LiDAR for encroachment and right-of-way monitoring along the corridor.
SAR through cloud cover, change detection, geotagged field photos, crew coordination — all working with no backhaul.
IFC/BIM import, LoD2.2 reconstruction, and 3D asset editing toward a substation digital twin.
TAK/ATAK crew tracking, tasks, GeoChat, and offline routing — the field and the EOC share one picture.
Drone FMV geo-locked to the line with AI object detection for pole and tower structural review.
A portable, offline grid intelligence workstation for surveys, studies, and client deliverables in 30+ formats.
“Sharing damage-assessment data over the LAN cut our storm-response cycle by 45 minutes — crews rolled with the right picture instead of waiting on the server.”
— GIS Manager, Regional Electric Utility
Run the installer, and in seconds your workstation is hosting, editing, and sharing the utility's geospatial data — no cloud, no server farm, no waiting. Pairs with GRID State for full utility operations.
