A full suite of 2D/2.5D/3D geospatial analysis — viewsheds and line-of-sight for corridor and tower siting, shadow-height measurement of structures, solar studies, routing, and spatial statistics — with results rendered live in the scene.
Real-time shadow calculation and shadow-height mensuration — measure pole, tower, and building heights from imagery, and assess solar potential for utility-scale siting.
3D visibility analysis for corridor siting and visual-impact review — line-of-sight, observer height, and color-coded visible/hidden terrain along proposed routes.
Terrain analysis using plane-of-best-fit, with slope categories and compass aspect — vet tower sites and access roads before crews roll out.
Interactive line drawing with detailed elevation charts along 3D linestrings — profile a proposed transmission route in seconds.
Multi-stop, air-gapped A* routing over your own road graph — sequence crew stops with turn-by-turn and GPX/KML export. Deep-dive →
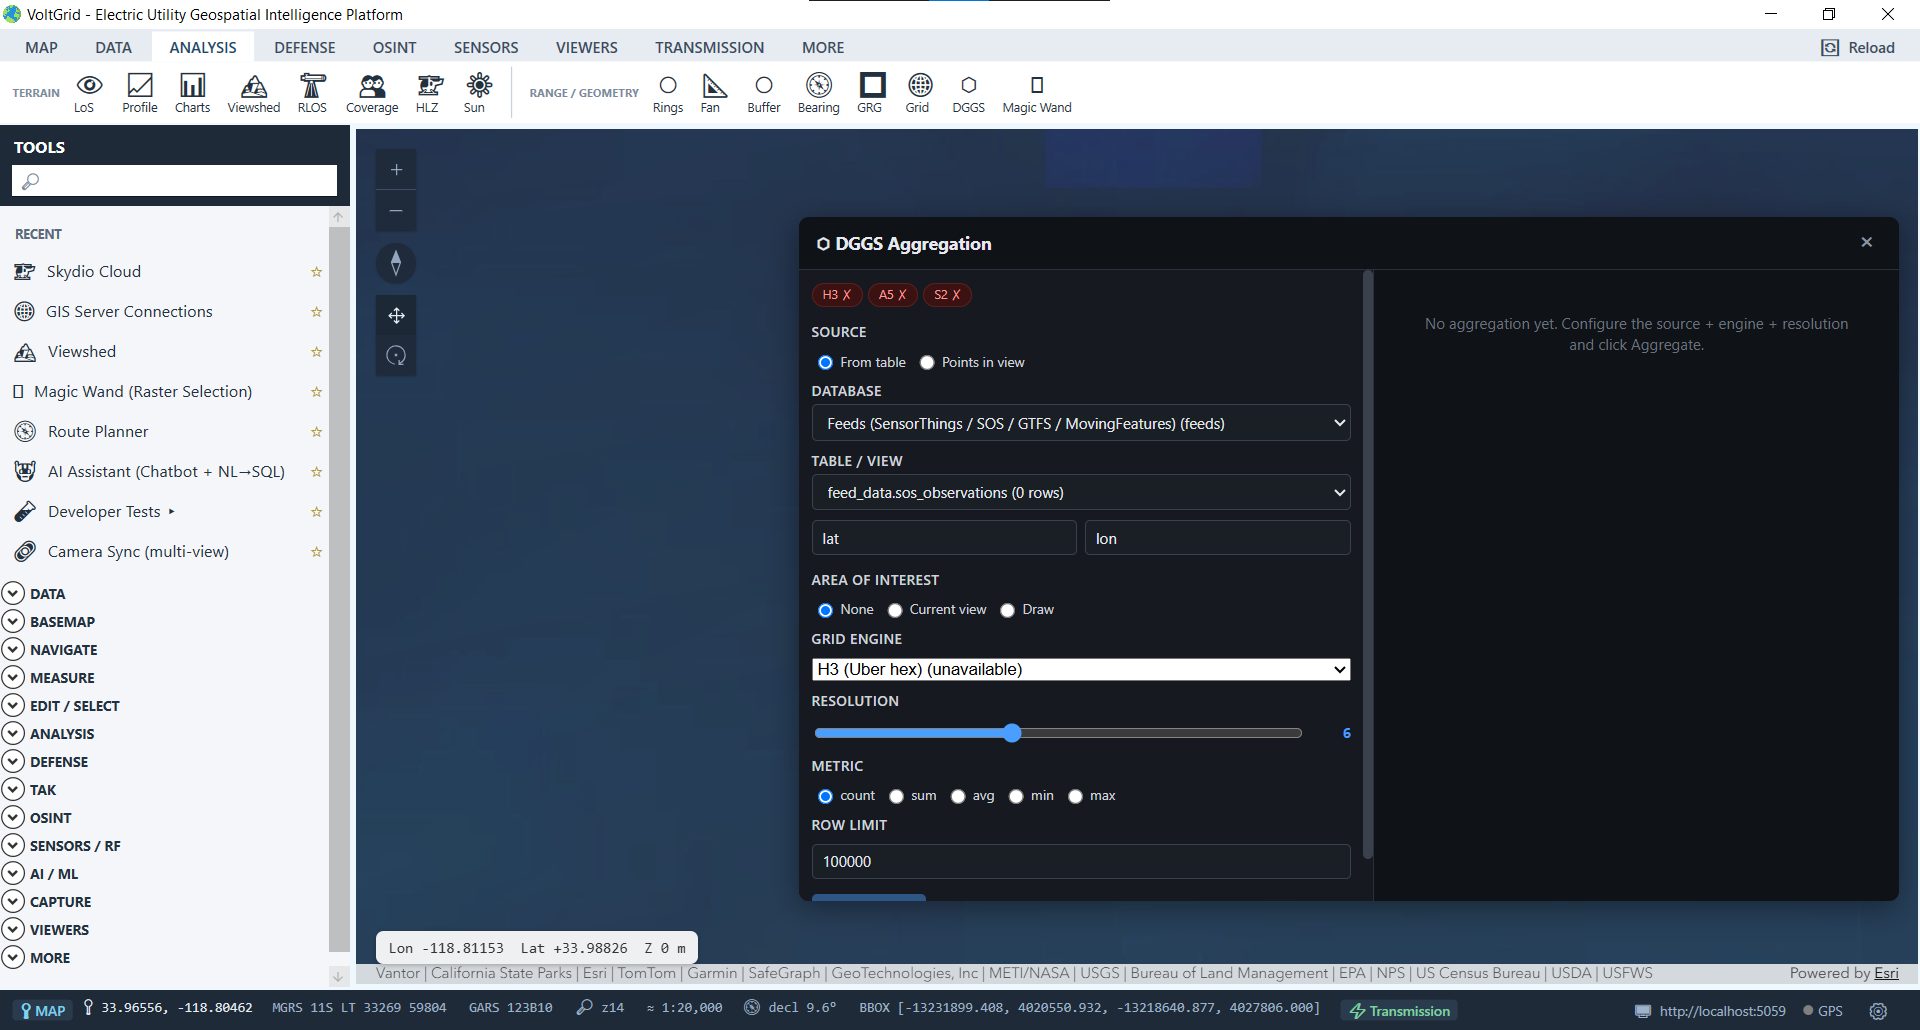
Hot-spot analysis, clustering, nearest-neighbor, and pattern detection — find outage clusters and failure-prone feeder segments.
Hydrological terrain analysis for drainage and catchment modeling — flood exposure around substations and structures.
Direct 3D distance, area, and volume calculations in the scene — spans, clearances, laydown yards.
Cut through 3D models to inspect substation interiors, underground plant, and sub-surface features.
The newest wave adds the planning primitives emergency-ops and siting teams expect — all terrain-aware, all rendered live in the scene.
Radial line of sight and multi-observer coverage — site monitoring cameras, radio links, and observation points along the corridor.
Range rings, sector range fans, and buffer/proximity zones around any substation, structure, or staging site.
Helicopter landing-zone assessment against slope and terrain constraints — for aerial line patrols and storm-damage overflights.
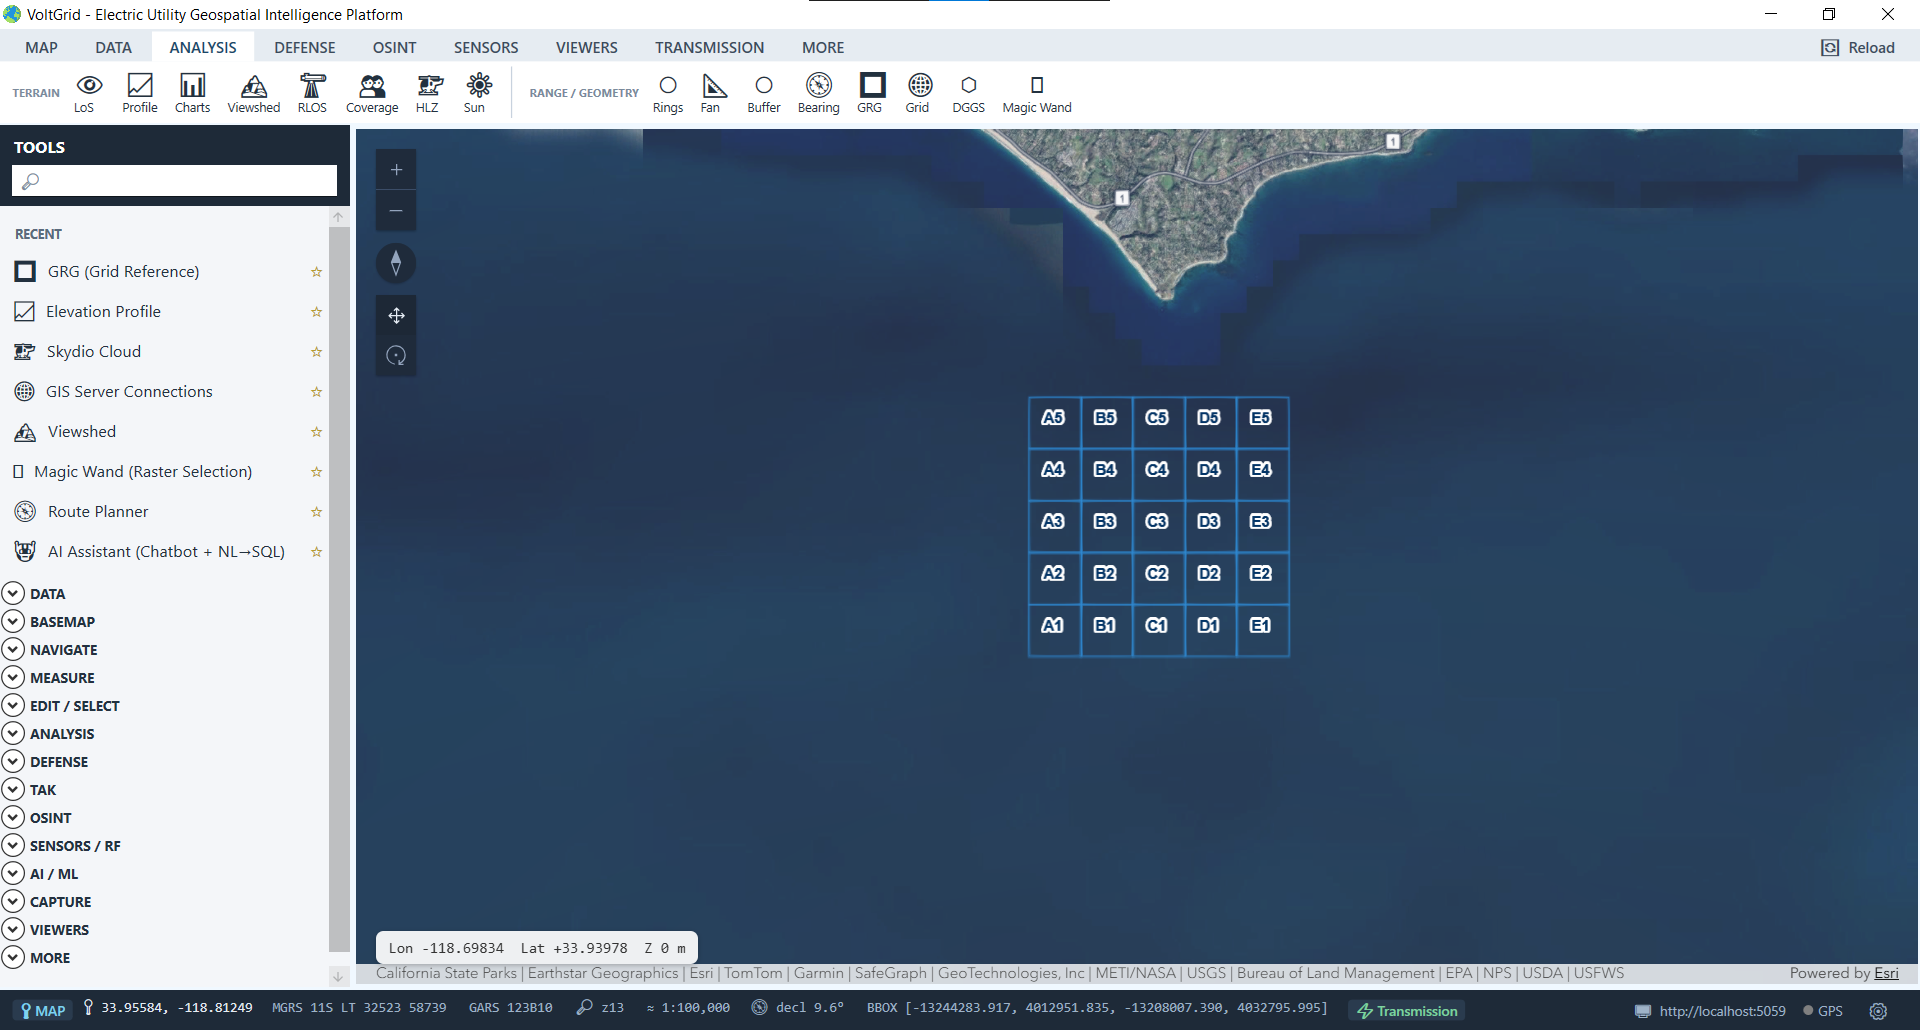
Grid Reference Graphics and graticule overlays for common referencing when coordinating with mutual-aid crews and emergency agencies.
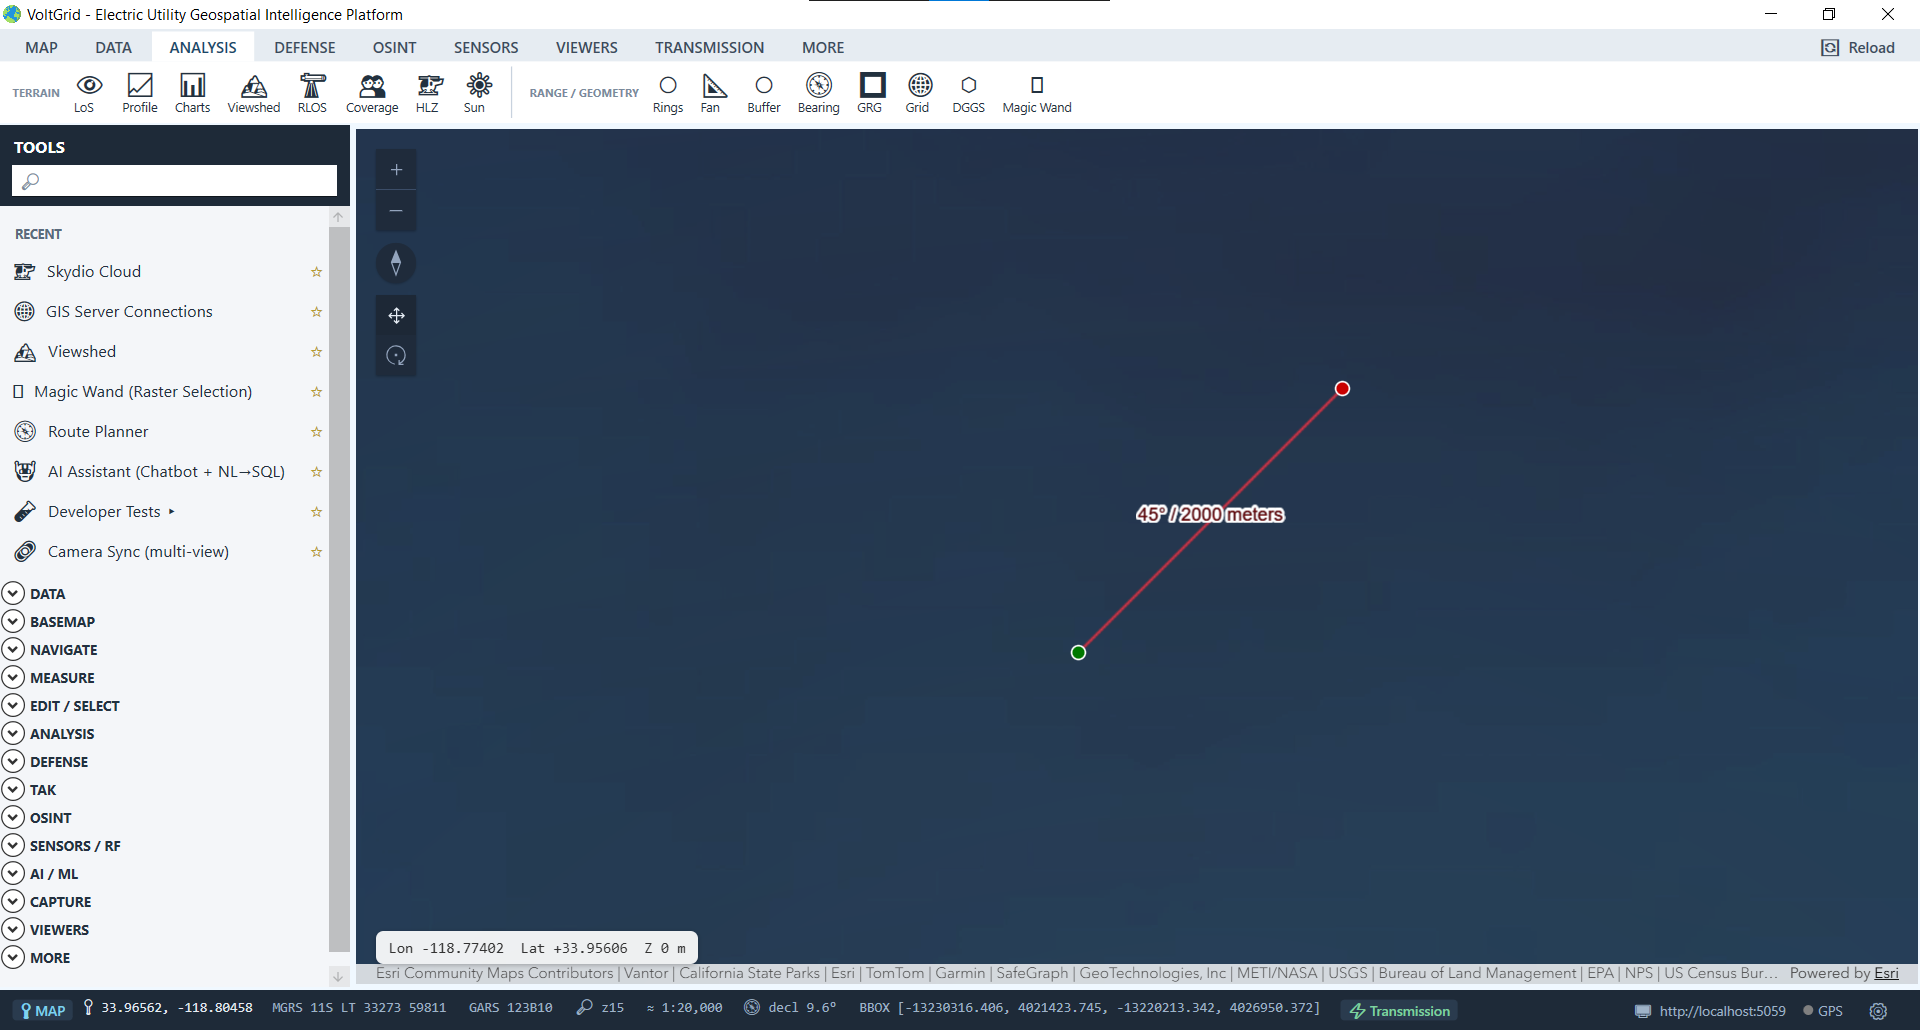
Quick bearing/distance and bounding-box tools wired into the status strip's MGRS/GARS readouts.
Network algorithms over your road and utility network graphs, alongside the air-gapped A* router.
Routing & navigation →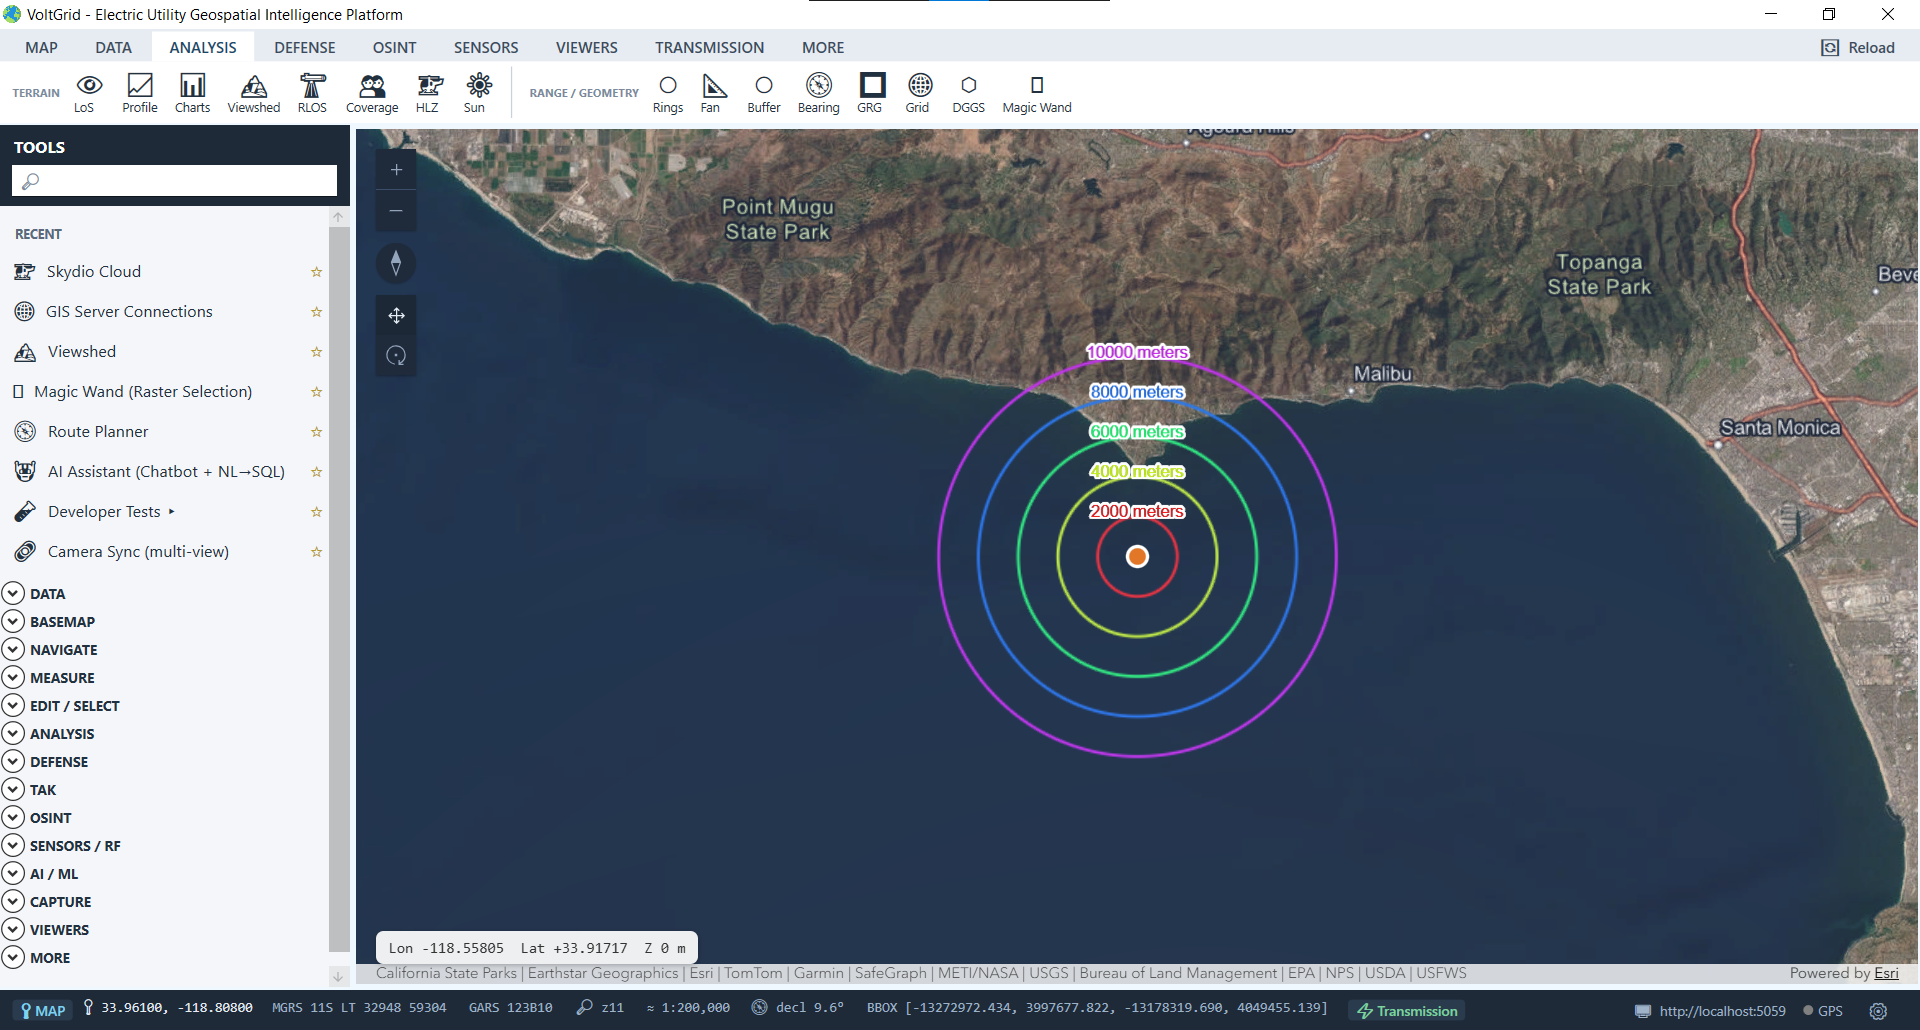
{
  "observerX": -74.0060,
  "observerY": 40.7128,
  "observerZ": 100,
  "viewDistance": 1000,
  "observerHeight": 1.7
}
→ 360° visibility, color-coded
Results aren't buried in tables — they render directly in 3D with Chart.js profiles and Three.js visualizations, ready for the siting review or the storm briefing.
