Push or poll outage polygons and SCADA tag points as GeoJSON or CSV — they land on one live overlay beside feeders, crews, and damage imagery. No proprietary OMS SDK required: if your OMS / historian can export HTTP GeoJSON or CSV (or you already bridge OT→IT over a URL), VoltGrid paints the picture.
Paste a FeatureCollection or CSV into the OMS panel, or point a poller at an HTTPS endpoint. Records upsert by stable geometry + discriminator — re-polls don't duplicate. SSE fans every change to the map overlay.
POST /api/oms/outages/import     ← GeoJSON / CSV
POST /api/oms/telemetry/import
GET  /api/oms/events             ← SSE fan-out
POST /api/oms/poll-config
{ url, intervalSec, kind: "outage"|"telemetry" }

GET  /api/oms/capabilities       // always 200
● overlay oms-scada · live
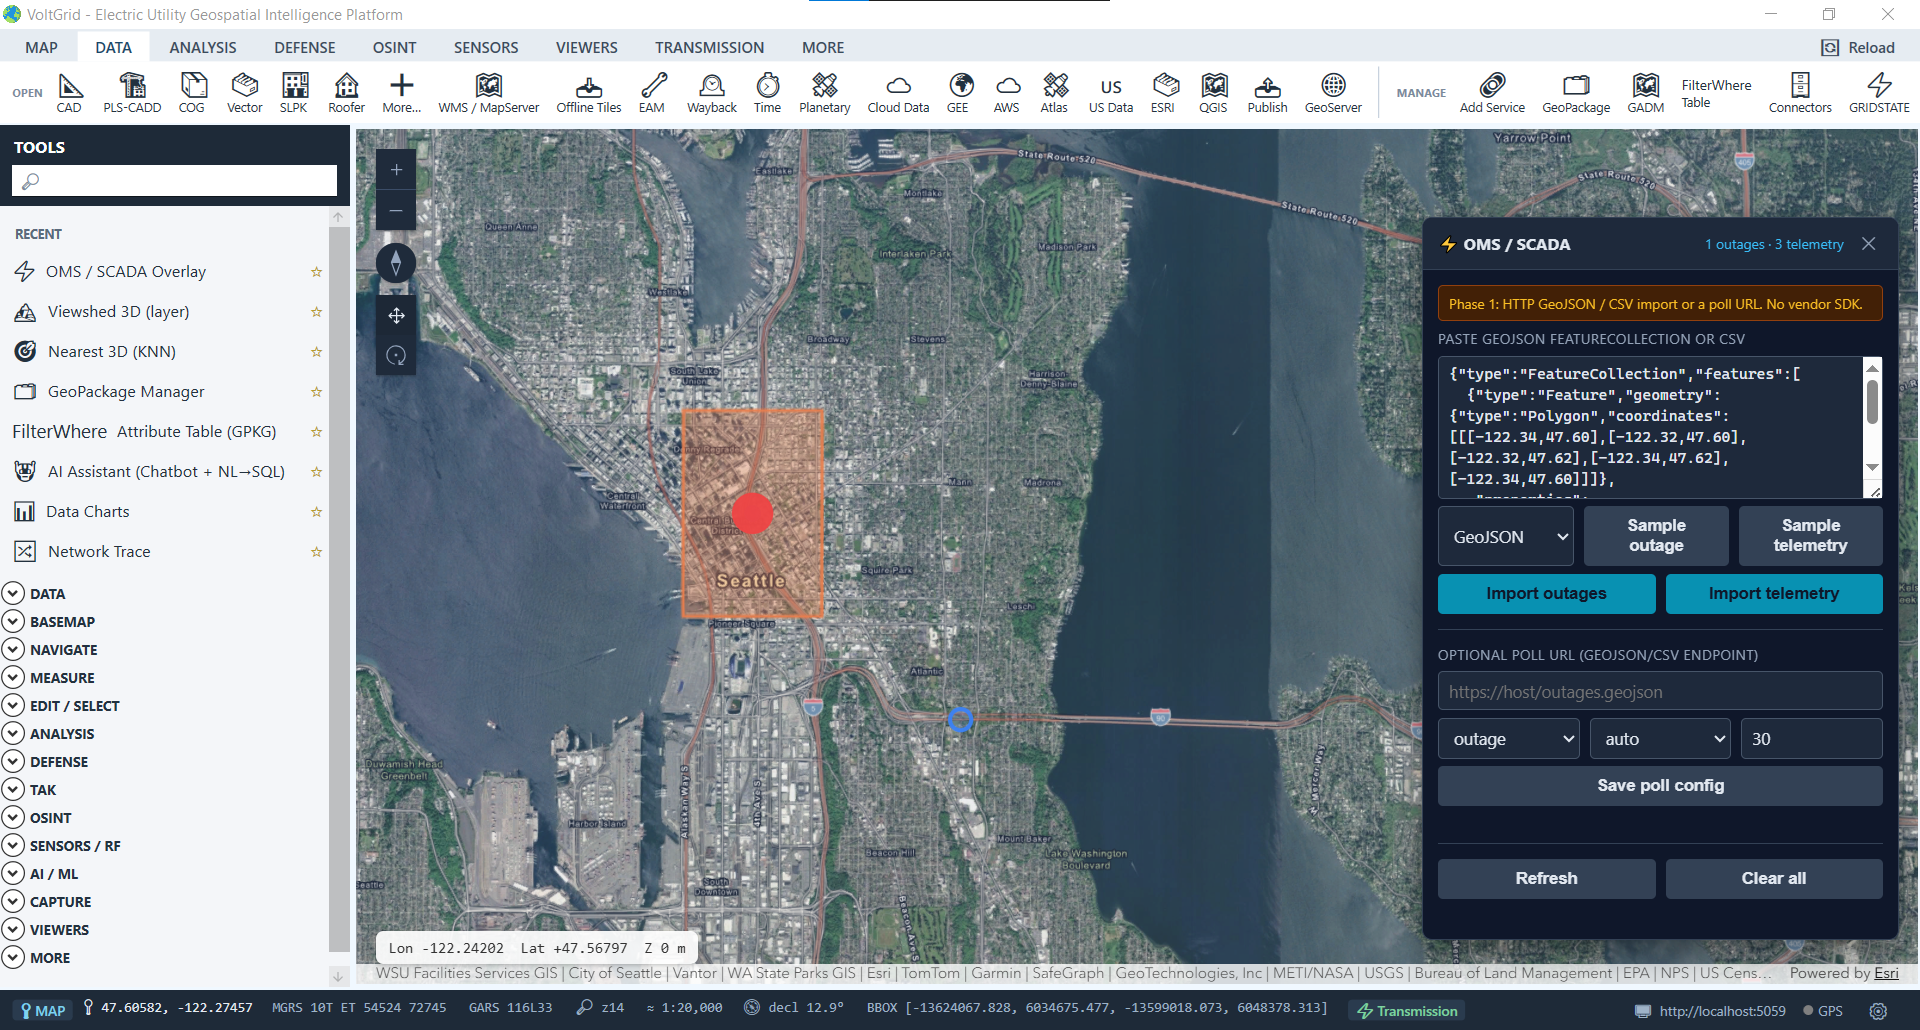
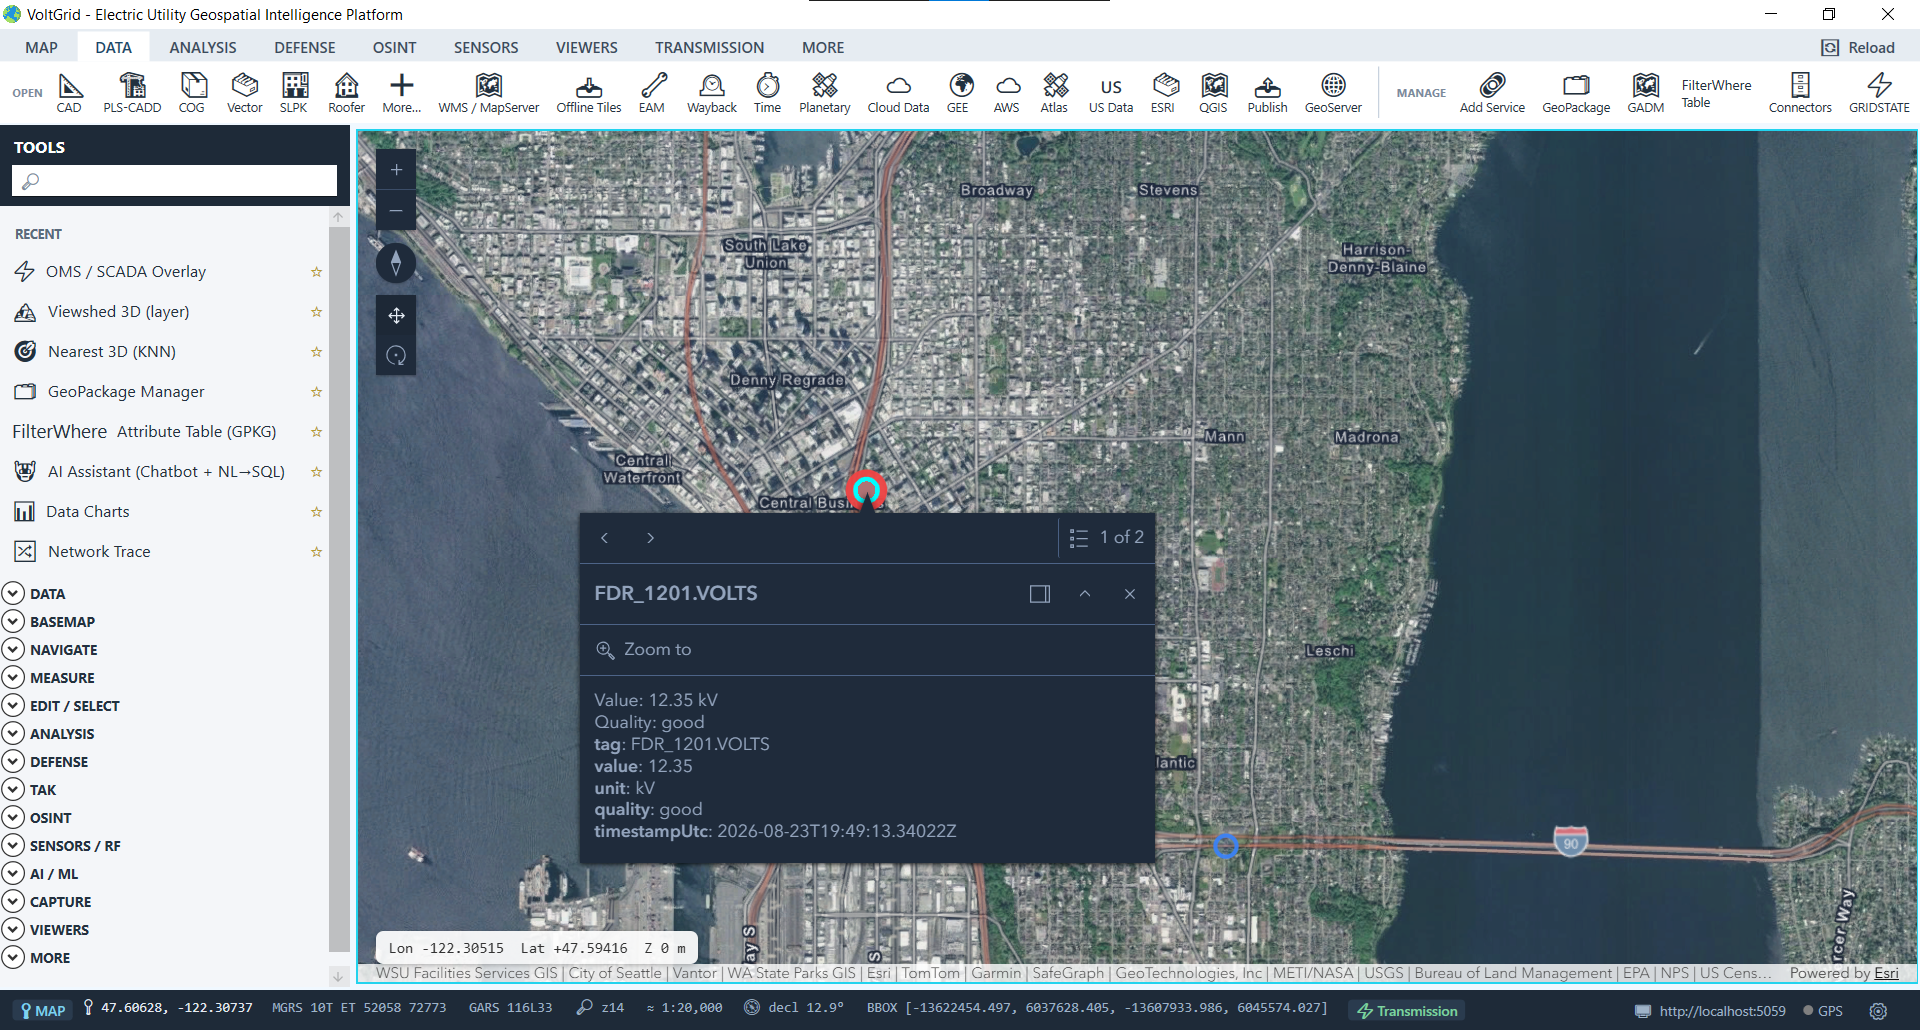
FDR_1201.VOLTS: 12.35 kV, quality: good, UTC timestamped) over SeattleSee reported vs restored at a glance while TAK crews and damage layers stay in frame.
Tag, value, unit, quality, timestamp — the live SCADA snapshot your gateway already exports.
One-shot paste for drills; poll config for the night shift when the OMS feed keeps moving.
Honest boundary: Phase 1 is an overlay over HTTP GeoJSON/CSV — not MultiSpeak, ICCP/TASE.2, DNP3, or OSI PI vendor connectors. Native OT protocol adapters remain roadmap; most utilities already bridge OT→IT to a URL VoltGrid can poll.
