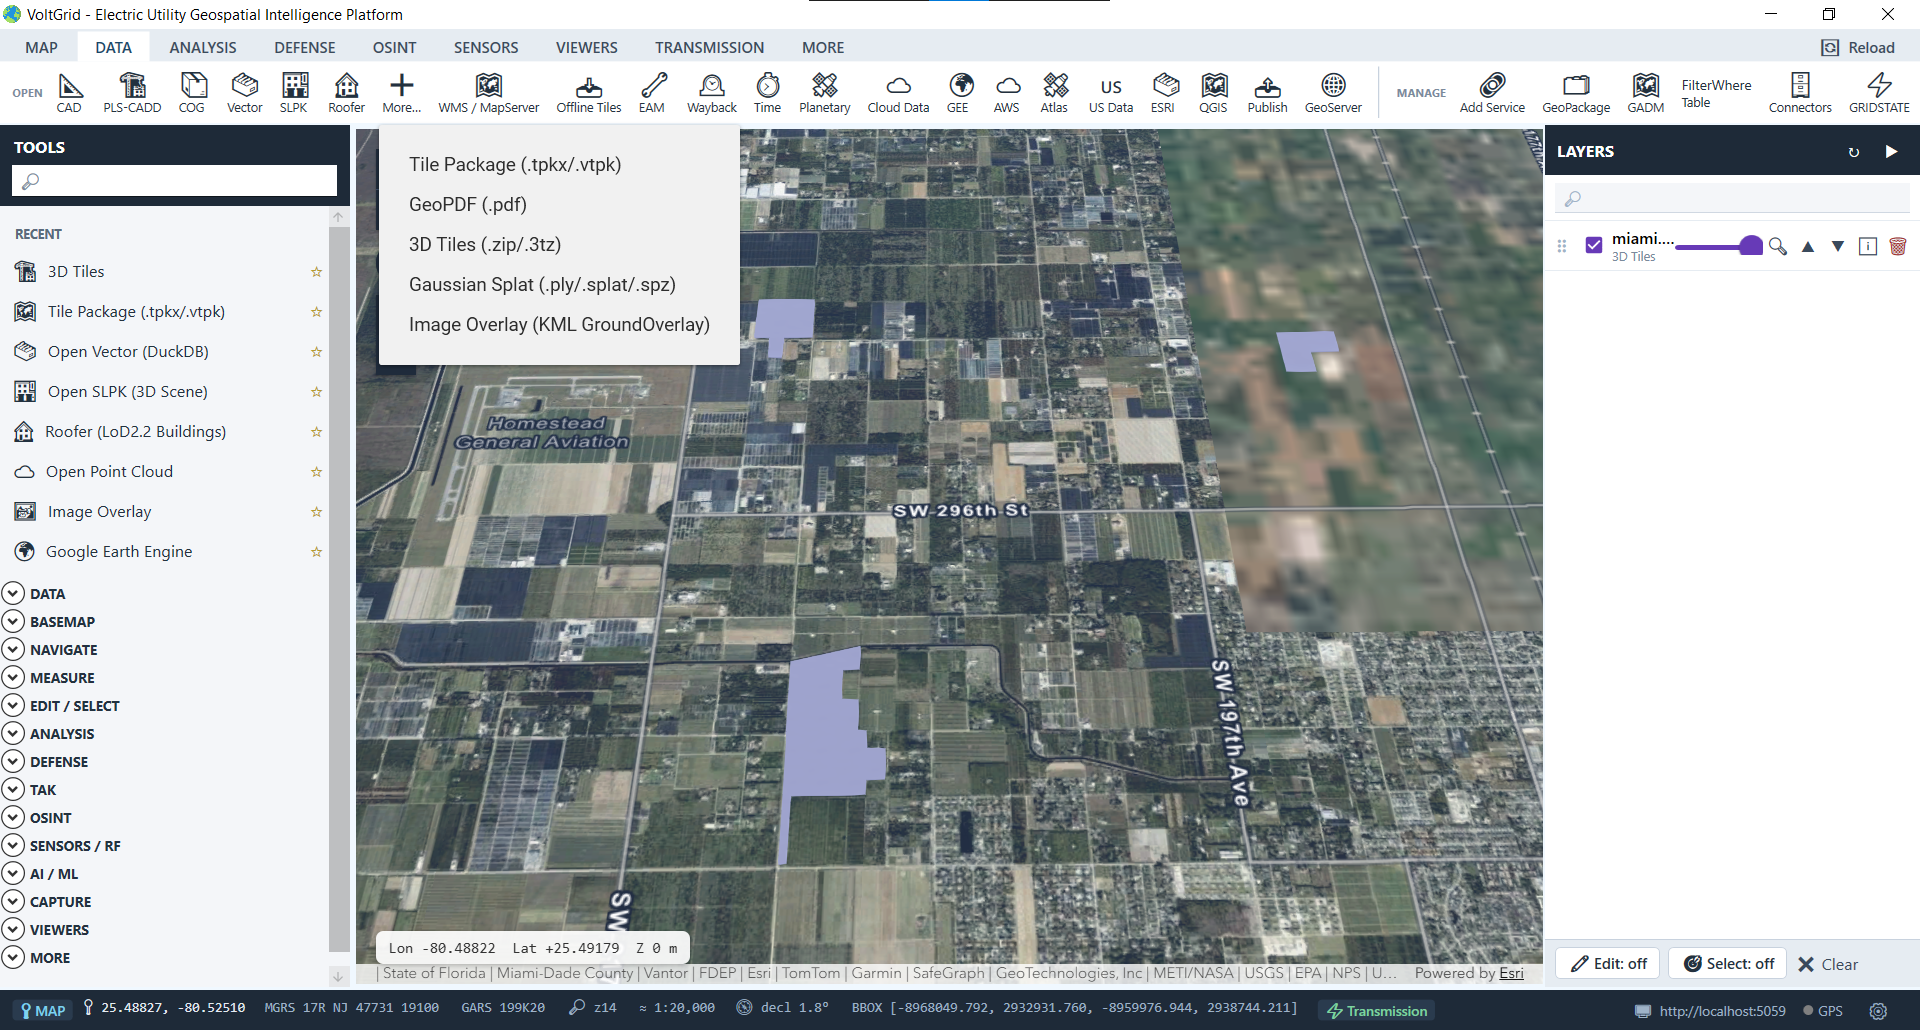
Every capability an electric-utility GIS team needs — visualization, editing, serving, analysis, real-time feeds, and data mastery — framed for the work of the grid: corridor mapping, substation digital twins, vegetation management, storm response, DER hosting, OMS overlays, EAM/CMMS, and field-crew coordination. Plus the v1.3–v1.6 waves: TAK & storm ops, radar and SAR, imagery analysis, AI/ML with SAM2 segment-anything, SharePoint, commercial imagery ordering, 3D reconstruction, plugins, the utility-ops quartet (DER · OMS · corridor damage · Maximo/Cityworks EAM), and the grid-operations wave (network trace · as-built QA · ROW encroachment · data charts · offline basemap packs). All in a single offline-capable desktop that works operationally with GRID State.
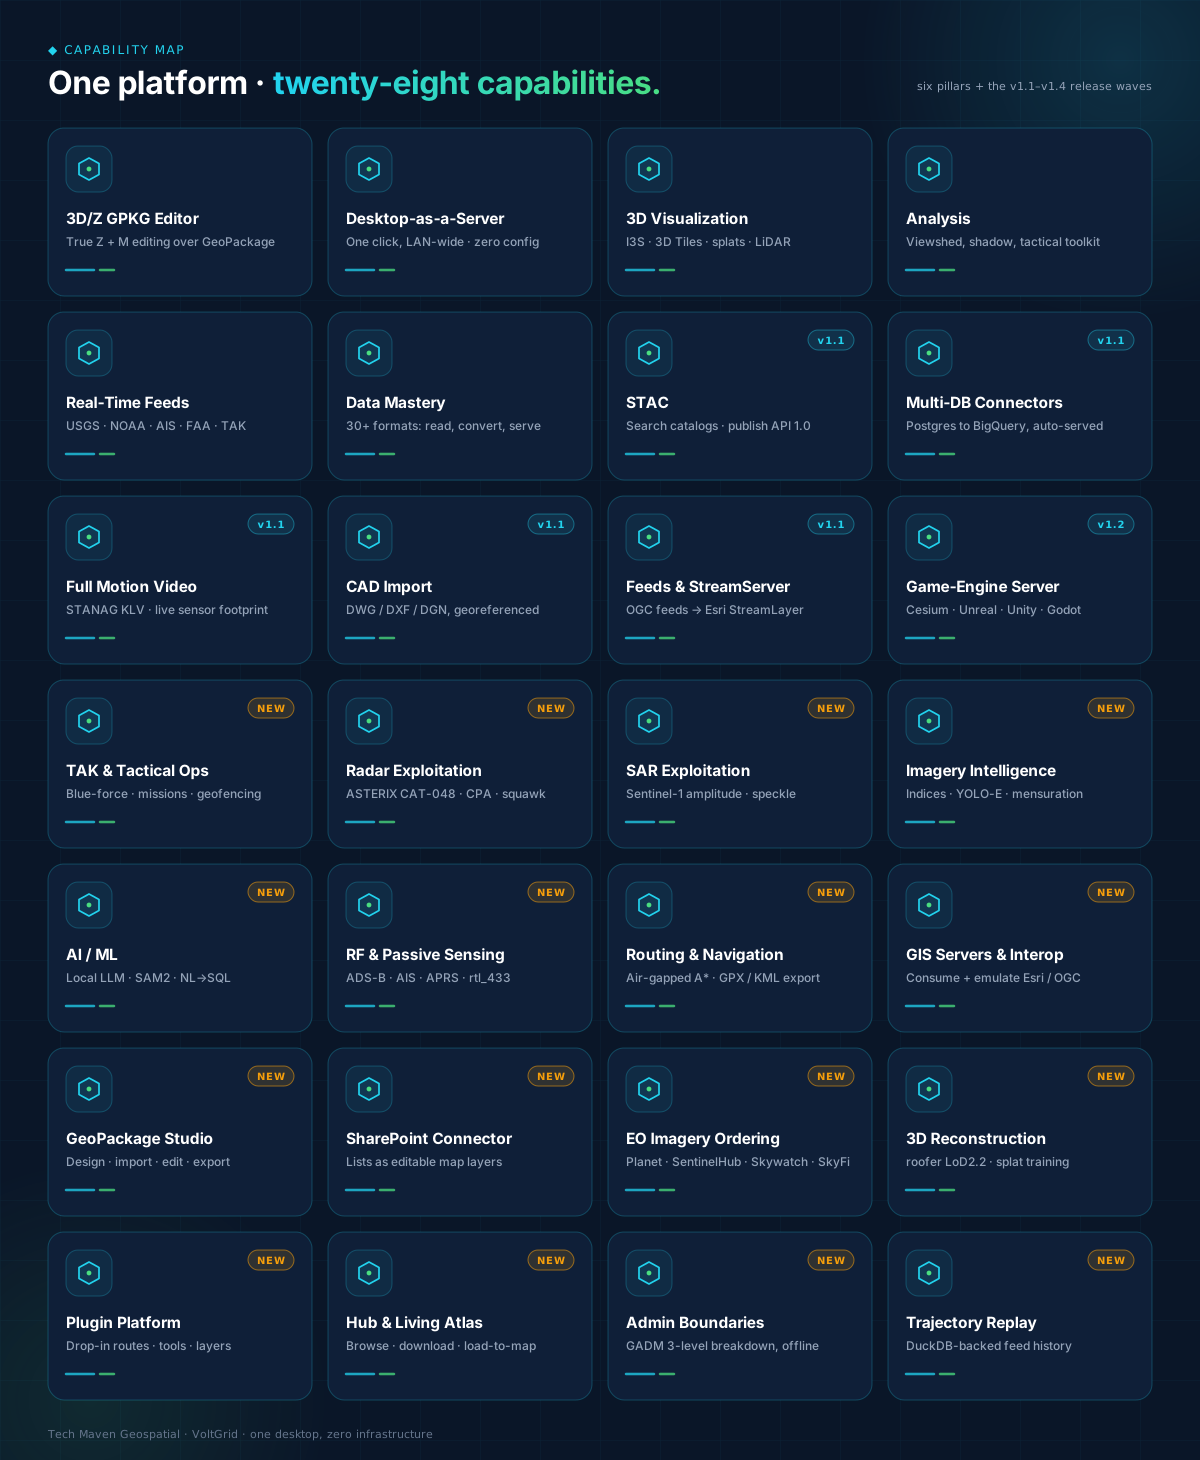
The full capability map — six pillars plus the v1.1–v1.6 release waves on one grid. Deep-dives below.
True 3D (Z + M) editing of poles, spans, and substation features over GeoPackage via an ESRI-compatible FeatureServer and the native Editor widget. Round-trips elevation exactly.
Deep-dive →One click turns the workstation into a LAN-wide OGC / ESRI / 3D-Tiles endpoint — built for OT networks and storm ops. Air-gapped, zero config, zero infrastructure.
How it works →Air-gapped terrain & imagery for Cesium (all engines), ArcGIS Maps SDK for Unreal/Unity, and Godot — quantized-mesh, WMTS, TMS XML, and LERC. Stream the grid digital twin into training simulators and planning environments where Cesium ion and ArcGIS Online are unavailable.
Engine integrations →Substation and corridor scenes: I3S SceneLayers from .slpk, Gaussian splats, OGC 3D Tiles, LiDAR point clouds, and streaming Cloud-Optimized GeoTIFF.
See the stack →Shadow & solar potential, viewshed, slope/aspect, routing, and spatial statistics with live 3D visualization.
Explore tools →NOAA weather, USGS quakes, operator Meshtastic mesh via MQTT, TAK/CoT crew tracks, APRS, AIS vessels, FAA aircraft, and IoT sensors — the live picture when the storm rolls in.
Live data →Live TAK crew-position tracking, GeoChat messaging, Mission Board tasking, and multi-user FeatureServer editing across the LAN.
Team tools →GeoPackage, GeoJSON, ESRI Geodatabase, Shapefile, KML, PMTiles, FlatGeobuf, COG — read, convert, and serve.
Full list →Search Element 84 & Planetary Computer, and publish your own rasters and point clouds as a spec-conformant STAC API 1.0.0.
Search & publish →Postgres, MySQL, SQLite, SQL Server, BigQuery, Google Sheets, Microsoft Fabric OneLake — auto-discovered spatial tables served as MVT, OGC Features, and FeatureServer.
Map your data →Drone inspection video of lines, poles, and substations — STANAG/MISB KLV playback with a live sensor footprint, DJI→STANAG conversion, and optional YOLO-E detections.
Geo-locked video →As-built DWG / DXF / DGN drawings onto the map via control-point or source-EPSG georeferencing — served as GeoJSON, MBTiles-vector, or GeoPackage.
Import drawings →Subscribe to SensorThings, SOS, GTFS-rt, and Moving Features into DuckDB; stream vehicles and crews to Esri clients as a native WebSocket StreamLayer.
Live streaming →Full TAK client (STOMP mTLS + UDP multicast), live crew overlay, GeoChat, ops board kanban with AAR replay, server admin dashboard, geofencing, and NAPSG/NWCG plus MIL-STD-2525 symbology.
Common operating picture →Airspace awareness around drone inspection ops — ASTERIX CAT-048 ingestion with a live Track Table, CPA calculator, velocity vectors, squawk alerting (7500/7600/7700), and track trails.
Track the picture →Storm and wildfire damage assessment through cloud — Sentinel-1 and multi-mission SAR amplitude viewing with speckle filtering, dB rendering, and an optional SNAP processing sidecar.
See through clouds →ImageServer-grade analysis on the desktop: vegetation indices for ROW encroachment, rendering templates, YOLO-E detection, annotation with PDF reports, and RPC mensuration.
Analyze imagery →Local LLM chatbot + NL→SQL (Gemma 3 / Phi-4), SAM2 segmentation (point/box → GeoJSON), and YOLO-E detection — all offline, no cloud AI.
On-prem intelligence →Click-to-digitize from any raster — CIELAB delta-E flood fill (port of the Kanahiro QGIS plugin). No model, no GPU, no sidecar. Millisecond polygon capture from orthophotos.
Click. Digitize. →ADS-B aircraft & RemoteID drones, AIS vessels, APRS, scanner audio, and rtl_433 IoT — every RF source fused into the DuckDB hub.
Listen to the spectrum →In-process A* routing over your own road graph — get crews to the damage air-gapped: multi-waypoint, turn-by-turn, GPX/KML export, plus graph analysis.
Plan the route →Plug into your utility's ArcGIS, GeoServer, QGIS Server & MapServer — and emulate FeatureServer, ImageServer, StreamServer, SceneServer, and tiles locally. Browse ArcGIS Hub & Living Atlas.
Speak every dialect →Design, import, edit, and export utility datasets as GeoPackage — schema editor, attribute table, Z-aware editing, and ESRI Geodatabase reading.
Master the GPKG →Any SharePoint list as an editable map layer — Entra ID delegated auth, five geometry shapes auto-detected, edits flow back via Microsoft Graph.
Map the list →Search, task, and order commercial EO imagery from Planet, Sentinel Hub, Skywatch, and SkyFi — for corridor monitoring and post-storm assessment — with your own accounts, straight from the map.
Order imagery →LoD2.2 building reconstruction from point clouds (roofer), FUSION/LDV forestry LiDAR, and Gaussian-splat training & viewing.
Rebuild the substation →Extend the platform with drop-in plugins: REST routes, sidebar tools, background workers, and new layer types — no rebuild of the app.
Build on it →Feeder choropleth from planner capacity tables + interconnection kW screen against remaining headroom. PLS-CADD geometry; optional findings write-back.
Map headroom →Live outages + telemetry from GeoJSON/CSV import or poll URL, with SSE fan-out. Vendor-SDK-free Phase 1 — not MultiSpeak/DNP3 (those stay roadmap).
Paint the outage →Before/after COG change detection — ΔNDVI, height-proxy, or storm/burn change — corridor-buffered with Transmission findings write-back.
Detect change →Assets and work orders from IBM Maximo and Cityworks on the map — loopback sidecar, DPAPI secrets, hybrid geo resolution.
Connect the EAM →Upstream / downstream / both from any structure over PLS-CADD topology — circuit filter, max hops, and isolation preview listing de-energized structures and sections.
Trace the feeder →Design vs survey PLS-CADD comparison — horizontal offset, Δz, Δheight AGL, span deltas — severity-graded with findings write-through.
Grade the build →Corridor buffer over conductor geometry ∩ parcels / buildings / roads — encroachments ranked by intersection area into the findings queue.
Sweep the ROW →Interactive Plotly charts from live layer attributes with bidirectional chart↔map selection and saved configs — DataPlotly parity, offline.
Chart the assets →Seven Maptoolkit vector basemaps online + AOI→MBTiles packager for any XYZ/TMS source, with a fully air-gapped MapLibre offline viewer.
Pack the tiles →NERC FAC-003 / NESC clearance & vegetation findings over PLS-CADD — now with operator-configurable My Layers (your own line FeatureLayer + additive 3D scene) and an ArcGIS-canonical findings FeatureServer.
Analyze the line →Design pole-inspection and damage-assessment forms bound to your layers — structured field capture on the same platform.
Design forms →PLS-CADD XML + KMZ engineering exports as structures and conductors FeatureLayers — the network backbone behind trace, DER, as-built, and ROW analysis.
Import the line →3D substation scanning, asset tagging, IFC/BIM overlay, LoD2.2 reconstruction, and geotagged inspection photos toward the substation digital twin.
Walk the yard →SensorThings, OGC SOS, MQTT, Kafka, StreamServer, HTTP poll, SSE, WebSocket — fault indicators, weather stations, and smart-grid telemetry on the map.
Wire the sensors →Live fleet and asset tracks — StreamServer, Moving Features, AIS, ADS-B, GTFS-RT, TAK CoT, Skydio drones, GNSS/NMEA — unified in one tracks store.
Track the fleet →The business case: infrastructure displacement, productivity gains, and package tiers.
See the value →