Before / after on the corridor — vegetation and storm damage. New

Pick two registered COGs that cover the same ground. VoltGrid samples them onto a shared grid, scores change, classifies severity, and drops hotspots on the map — optionally clipped to a PLS-CADD conductor buffer and written into Transmission findings. Built for vegetation managers and storm desks who already collect pre/post orthos.

ΔNDVI (spectral)Height proxy (DEM/DSM) Storm / burn changeCorridor buffer Findings write-backPure C# · no sidecar
Three modes · one panel

Encroachment, height, or “what changed.”

  • Spectral (ΔNDVI) — NIR + Red bands; negative = canopy loss, positive = gain / encroachment. Default gate 0.20 ΔNDVI.
  • Height — DEM/DSM pair (or two-date DSM) as a LiDAR height-proxy; default gate 2 m. Not a LAS classifier — honest height from COG elevation surfaces.
  • Change — normalized brightness difference for storm / wildfire damage on panchromatic or single-band imagery.
  • Corridor scope — optional buffer around PLS-CADD conductors so hotspots stay on the ROW, not the whole scene.
/api/corridor-damage
POST /api/corridor-damage/analyze
{
  beforeCogId, afterCogId,
  mode: "spectral"|"height"|"change",
  conductorDbId?, bufferMeters: 30,
  writeFindings: true,
  findingCategory: "vegetation"
}
→ hotspots[] + summary + corridorGeoJson?

GET /api/corridor-damage/capabilities
In-App Walkthrough

Corridor Vegetation & Storm Damage Analysis

Watch the full change-detection run over Lisbon: LiDAR height-proxy mode classifies structure and canopy delta across 408 flagged hotspots on the transmission right-of-way.
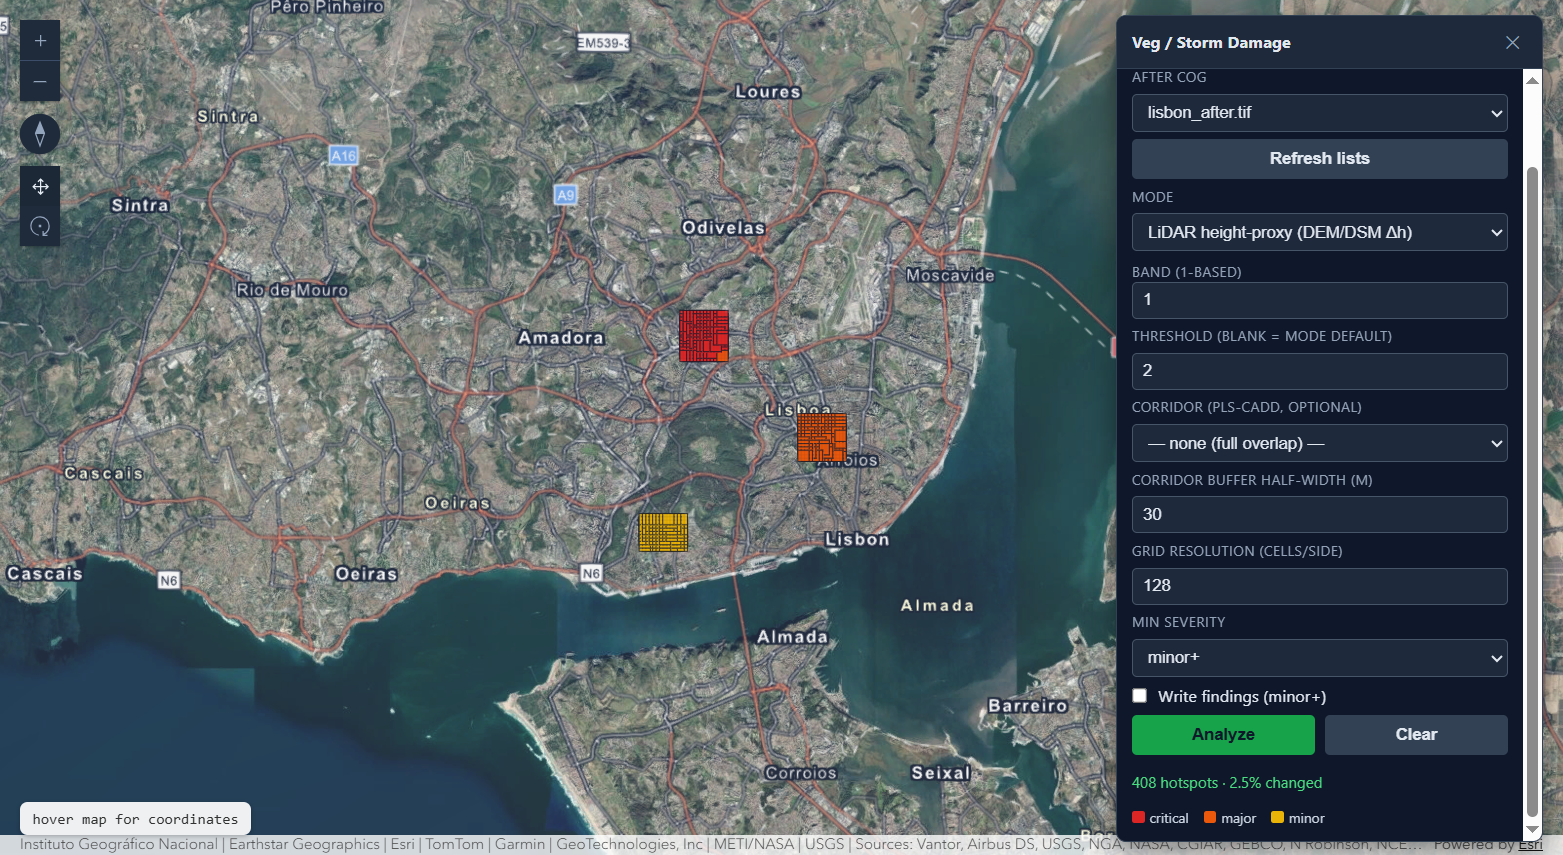
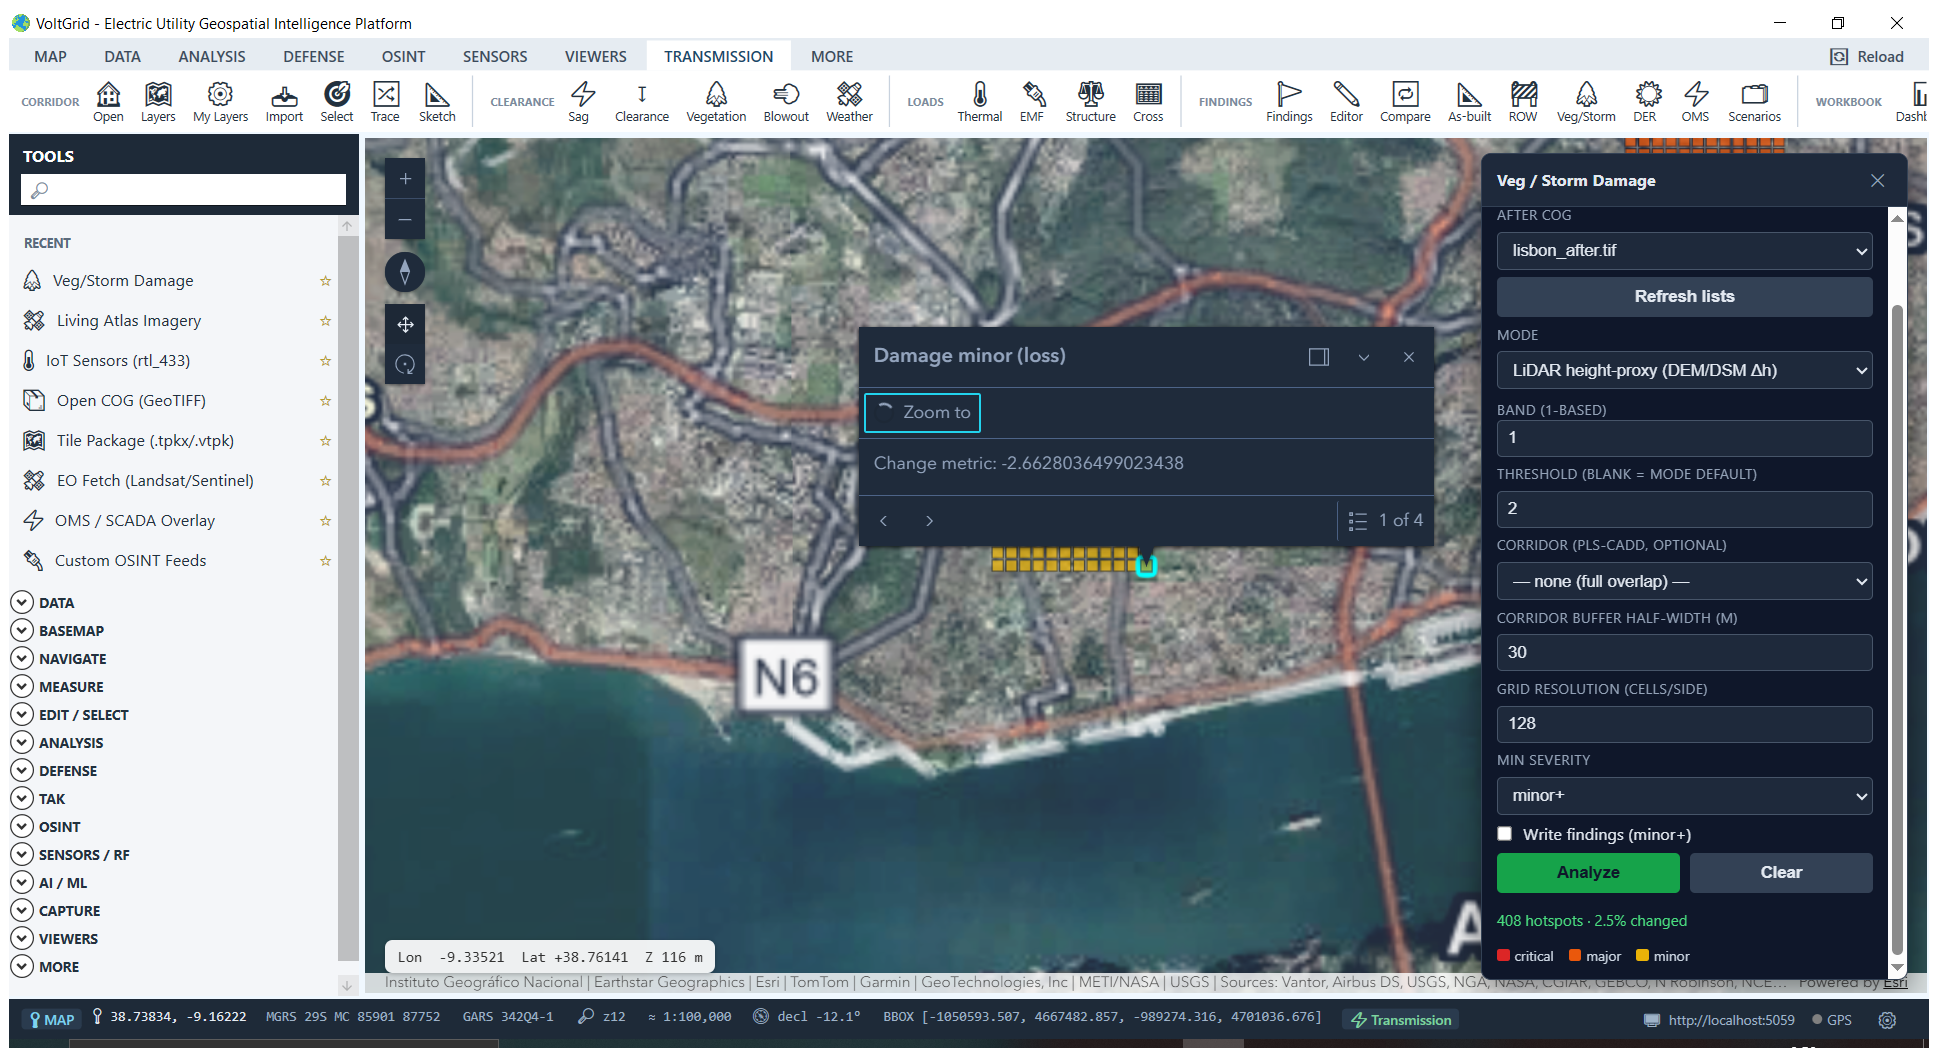
Live screen recording — running LiDAR height-proxy (DEM/DSM Δh) corridor change detection with 30 m buffer, flagging 408 hotspots over Lisbon aerial imagery
VoltGrid desktop — Transmission corridor damage analysis map overview with 408 hotspots across Lisbon
Corridor damage map overview: 408 hotspots classified across critical (red), major (orange), and minor (yellow) severity clusters over Lisbon and Amadora
VoltGrid desktop — Transmission corridor damage hotspot feature selected with delta inspection popup
Feature selected inspection: active identify popup displaying specific change metric (−2.66 m Δh minor loss) with zoom-to and multi-result navigation
Distinct from NESC vegetation clearance

Raster change ≠ conductor-to-canopy math

Transmission Analyzer’s TlVegetation engine computes NESC / NERC FAC-003 clearances. Corridor Damage is the map-driven before/after raster workflow. Use both: clearances for compliance, change detection for patrol prioritization after a storm or grow-in season.

🌲

Vegetation hotspots

ΔNDVI hotspots ranked minor → critical, ready for crew routing and work orders.

🌪️

Storm / burn screen

Brightness change mode for cloudy or single-band post-event collects.

📐

Height proxy

DEM vs DSM (or multi-date DSM) flags structure / canopy gain-loss without a new LiDAR stack.

Honest boundary: Phase 1 is windowed change detection over geographic COGs — not eCognition / object-based segmentation, and not a point-cloud classifier. Geographic (EPSG:4326) COGs recommended.