Register a multispectral COG of your corridor and the in-process server exposes it through an ArcGIS REST ImageServer surface — exportImage, identify, computeHistograms, getSamples — with server-side raster math for vegetation indices, sensor-aware rendering templates, AI object detection that returns FeatureSets, and mensuration with stated confidence. From ROW encroachment screening to storm and wildfire damage assessment: no pre-computation, no cloud, no per-analysis wait.
The ImageServer facade is compatible with the ArcGIS JavaScript SDK and existing GIS infrastructure — the analysis endpoints your GIS team expects, served from one workstation.
exportImage — rendered windows with a renderingRule raster function, from true color to burn severity.identify — pixel values at a point, straight off the source raster.computeHistograms & getSamples — statistics and sample extraction for quantitative work.# NDVI, computed server-side at request time GET .../ImageServer/exportImage ?renderingRule={"rasterFunction":"NDVI", "rasterFunctionArguments": {"NIRBandId":8,"RedBandId":4}} # exploitation surface GET .../ImageServer/identify GET .../ImageServer/computeHistograms GET .../ImageServer/getSamples POST .../ImageServer/detectObjects → FeatureSet GET .../ImageServer/dlModels
Server-side raster functions and a curated template catalog turn multispectral COGs into vegetation-health and damage views in one call.
NDVI, NDWI, NBR and more — including EVI, SAVI, MNDWI, NDBI, and NDSI — computed via server-side raster math on any registered COG. Canopy stress along the ROW, one request away.
Pre-configured visualizations spanning natural color, color infrared, vegetation health, water and moisture, burn severity (dNBR), urban, geology, snow/ice, and thermal views.
Sensor-aware defaults with automatic detection — Sentinel-2 (13 bands, including cloudless), Landsat 8/9 (11 bands with thermal), MODIS, and NAIP are recognized on registration.
createComposite builds mosaic, time-series, and band-composite virtual rasters as lightweight XML pointing at the source COGs — no data duplication, lazy reads.
Stack temporal scenes into a time-series service and compare periods — pre- and post-storm passes, or wildfire burn-severity mapping with dNBR.
createDynamic watches a directory with a filename pattern and auto-refreshes the service as new scenes arrive.
The YOLO-E detection pipeline is wired directly into the ImageServer: render a COG window to PNG, run zero-shot detection, geo-reference the pixel boxes back to polygon rings, and return a spec-conformant ArcGIS FeatureSet any Maps SDK client can draw.
POST .../ImageServer/detectObjects with bbox, size, threshold, and classLabels; GET works too.f=json returns the FeatureSet; f=image returns an annotated PNG.GET .../ImageServer/dlModels lists available detection models.{available:false, detections:[]} and the app keeps working.// COG window → PNG → detect → geo-reference POST .../ImageServer/detectObjects { "bbox": [...], "size": [...], "threshold": 0.5, "classLabels": [...] } → FeatureSet (f=json · polygon rings + class + confidence) → PNG (f=image · annotated) // sidecar down? honest degrade: { "available": false, "detections": [] }
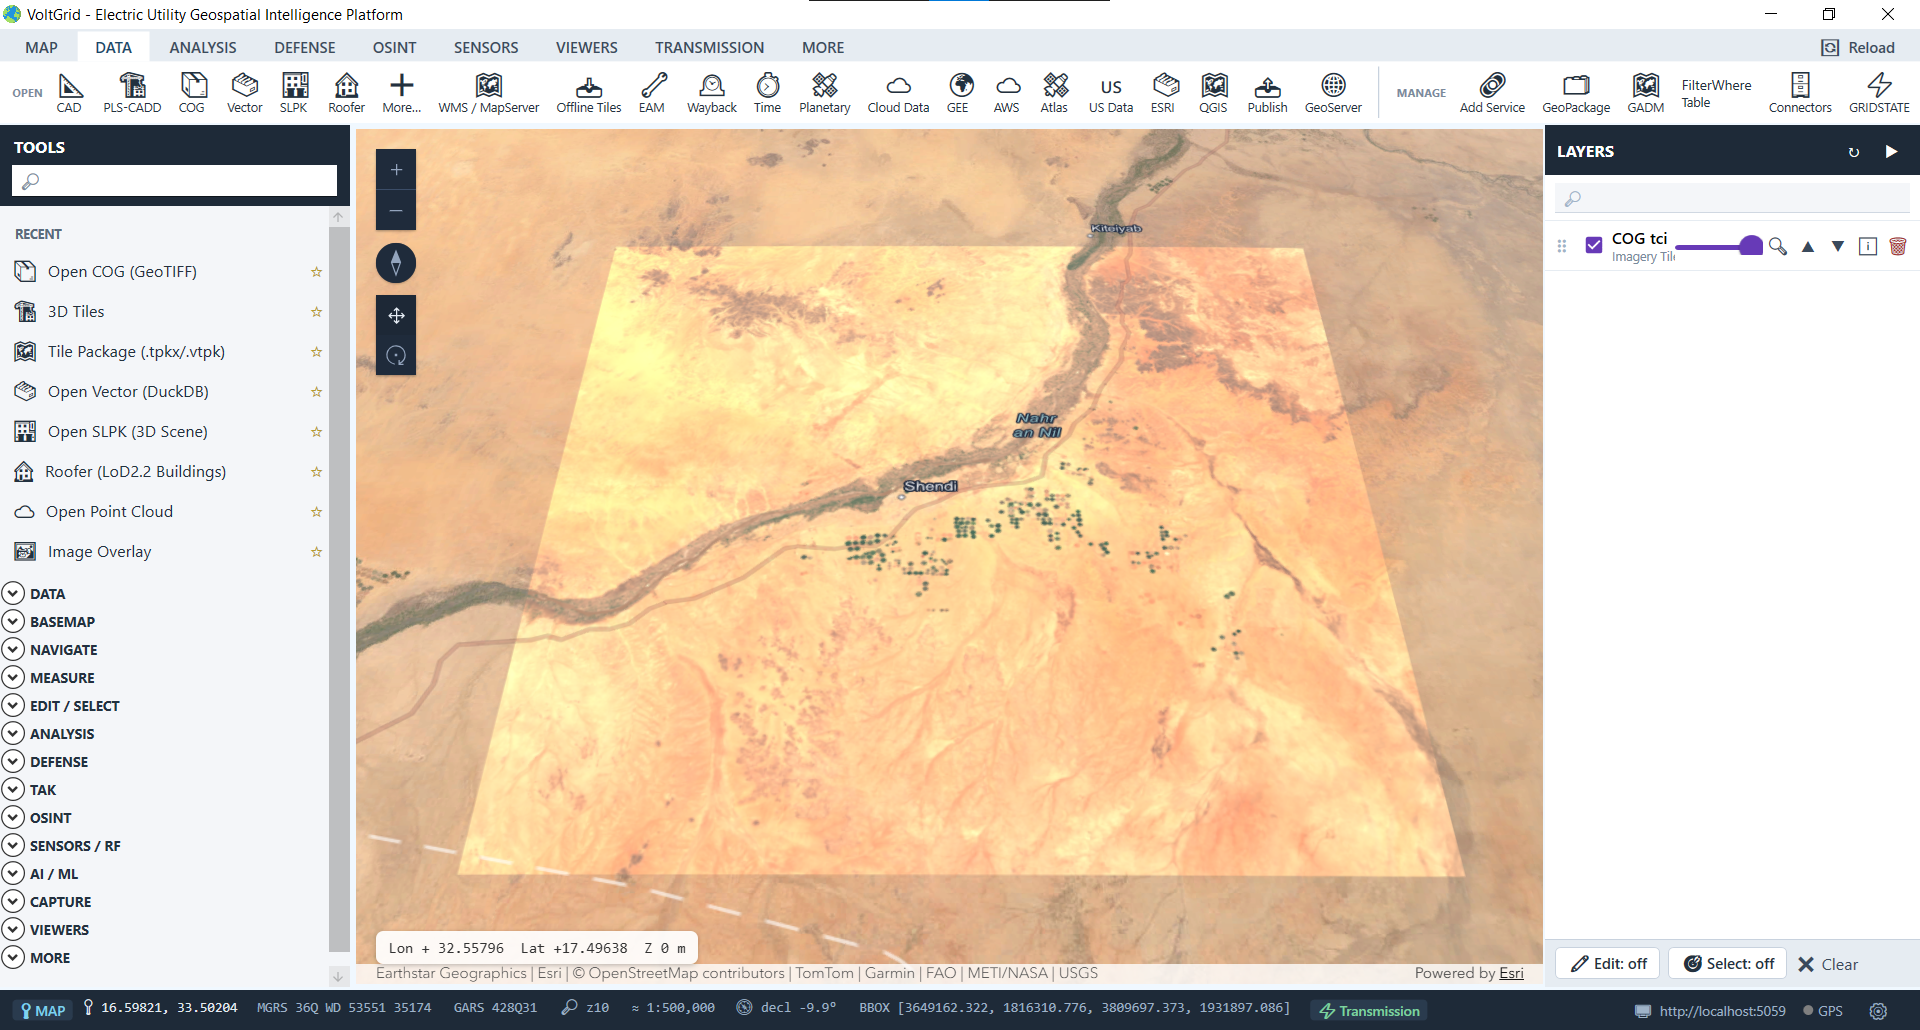
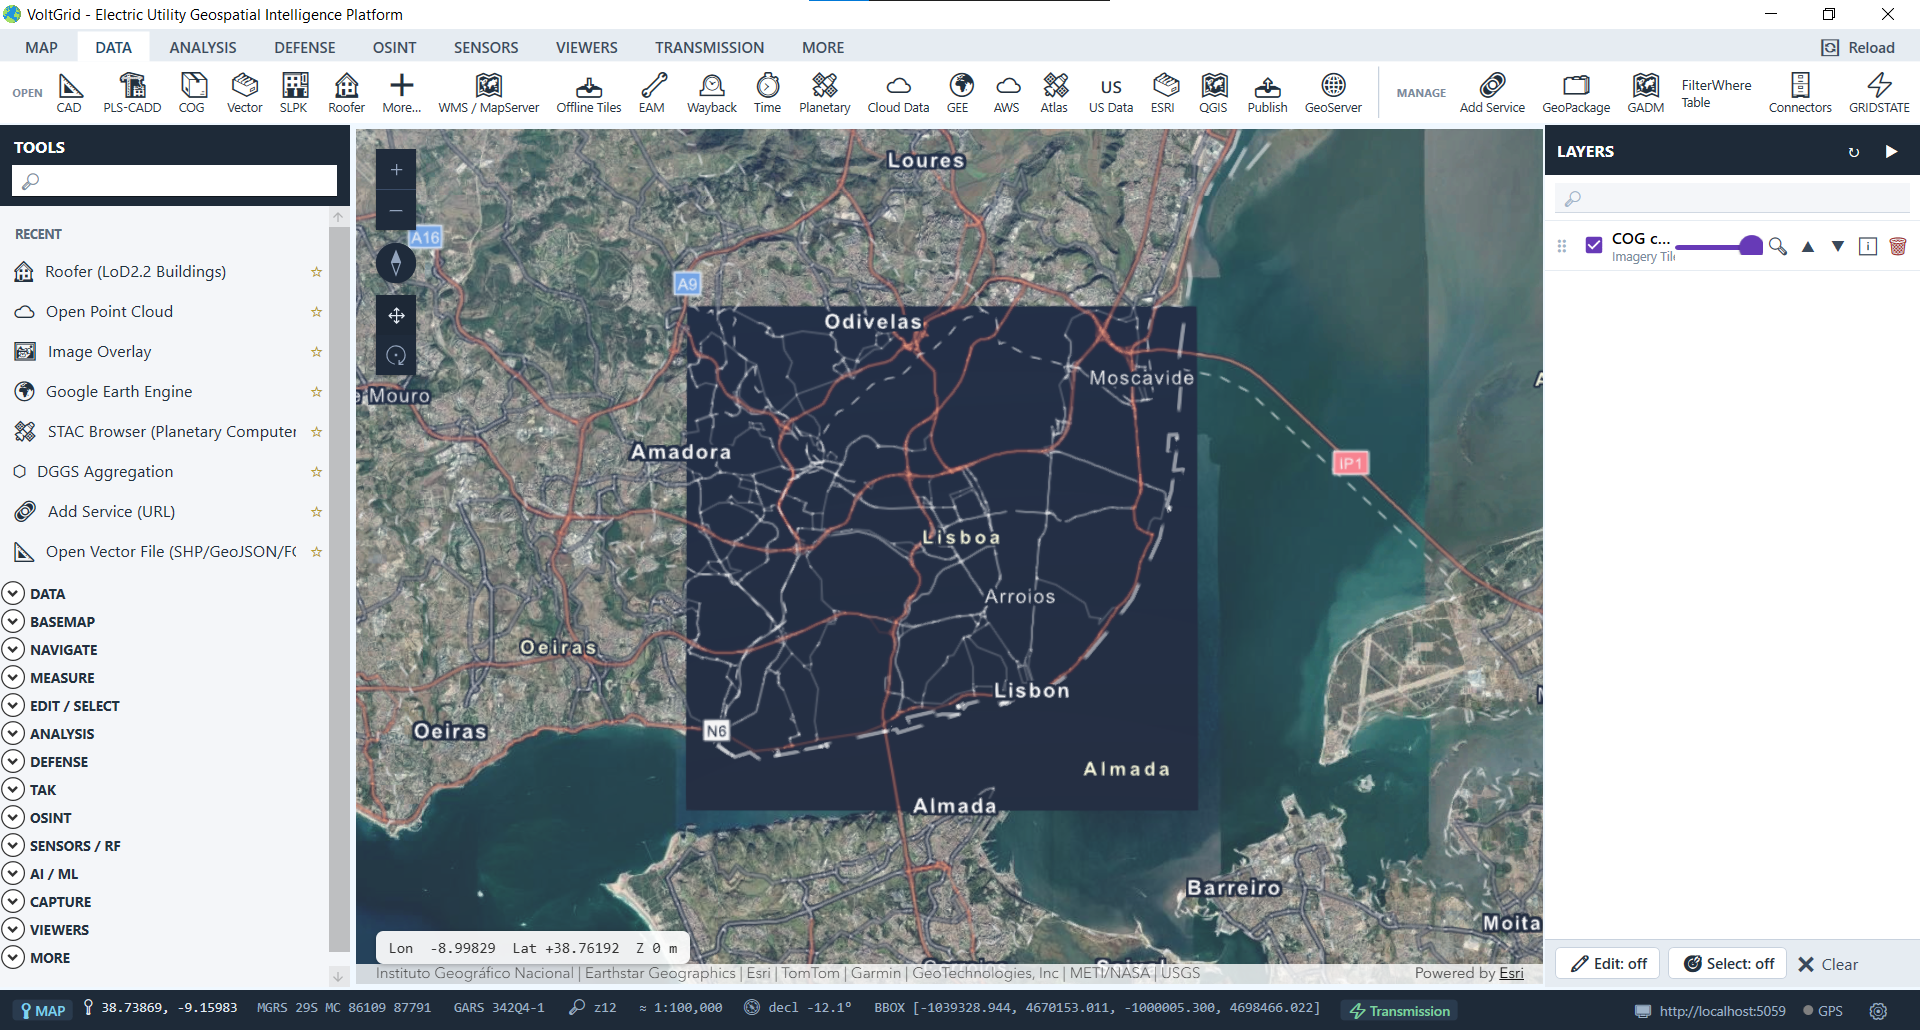
Analysis ends in a product — annotated damage and encroachment graphics with measurements the reader can trust.
Indices, detections, annotations, and mensuration on the same map as your feeders and crews — served from one desktop, consumable by any ArcGIS REST client. VoltGrid works operationally with GRID State, Tech Maven Geospatial's electric utility management solution.
