Electric network connectivity over the PLS-CADD lines you've already imported: trace upstream, downstream, or both from any start structure, filter by circuit, cap the hops — and preview an isolation by opening cut points to see exactly which structures and sections go de-energized. On the map, in an in-map panel, fully air-gapped.
"If I open these two structures, what goes dark?" Network Trace builds a connectivity graph from your PLS-CADD conductors — from_structure → to_structure, section by section — and walks it in milliseconds. Results highlight live on the map next to your outage overlay and corridor findings.
circuit_id filter and maxHops cap.plscadd_*); geometry is only needed for the highlight.POST /api/networktrace/build
{ "dbId": "plscadd_7f2a" } → nodes · edges · circuits
POST /api/networktrace/trace
{ "startStructure": "T-114",
"direction": "downstream", "maxHops": 40 }
POST /api/networktrace/isolation
{ "openStructures": ["T-114","T-131"] }
→ de-energized structures + sections, highlighted
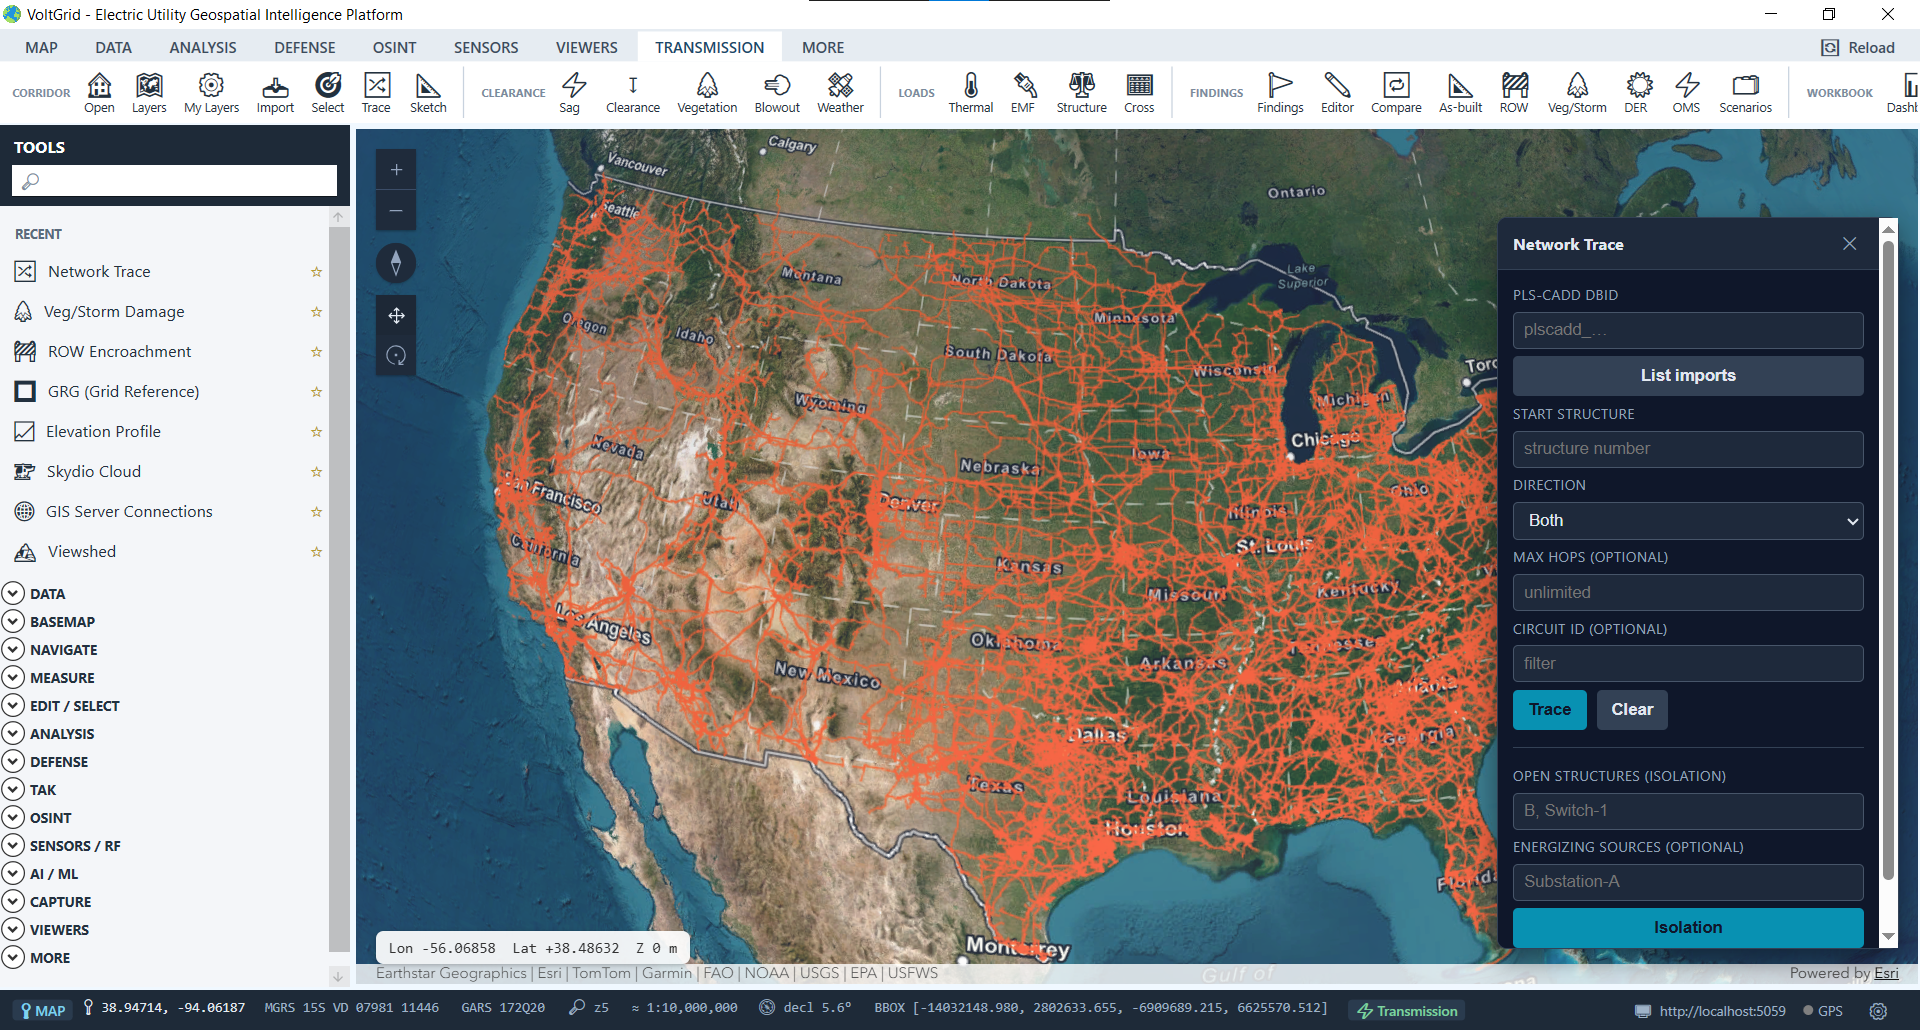
Preview which spans a clearance affects before the switching order is written — and see it against parcels, crews, and outages.
Trace downstream of a damaged structure from the corridor-damage findings to bound the customer impact area.
The BFS engine sits behind a plain REST contract with unit-tested isolation semantics — batch what-if runs from any script.
Honest boundary: Phase 1 is a connectivity trace over imported PLS-CADD topology — it is not load flow, protection coordination, or a live switching/OMS integration, and it requires structure/section data with consistent structure numbers. Pair it with the OMS/SCADA overlay for the live outage picture.
